ONU Offline Troubleshooting: A Practical Guide for ISPs running FTTH

Customer internet outages almost always start with the same symptom: the ONU/ONT goes offline.
For ISPs running GPON or EPON networks, troubleshooting ONU offline events is one of the most common operational tasks. Yet diagnosing the root cause is often slow because operators must jump between multiple tools, OLT CLI sessions, and monitoring systems.
A better approach is to have complete visibility into ONU state changes, optical signals, and historical behavior from a single place.
In this guide we’ll walk through:
- The most common reasons ONUs go offline
- How to quickly troubleshoot ONU outages
- How to detect partial fiber cuts and larger network issues
- How historical optical telemetry helps identify failing links or hardware
Examples shown below are taken from NetSense NMS, a network monitoring and observability platform built specifically for ISP access networks.
The Most Common Reasons an ONU Goes Offline
In GPON networks, ONU/ONT outages usually fall into a few predictable categories.
Understanding these categories is the first step toward faster troubleshooting.
Dying Gasp (Power Loss)
A Dying Gasp event occurs when the ONU loses power and sends a final signal to the OLT before shutting down (yes this is technically possible).
Typical causes include:
- Customer unplugging the ONU
- Local power outage
- Faulty power adapter
- Electrical instability at the customer premises
In many networks, this is the single largest cause of ONU downtime.
Optical Fault
An Optical Fault indicates a physical problem with the fiber path.
Typical causes include:
- Broken drop fiber
- Damaged cable in the building
- Bad splice or connector
- Dirty optical connectors
- Excessive attenuation
Unlike Dying Gasp events, optical faults usually require field technician intervention.
Unknown Events
In some cases the exact reason cannot be determined immediately, especially when the OLT is not reporting it properly via SNNP or Syslog (e.g. usually EPON OLTs tend to have this issues more often than not).
This is where correlating optical metrics and historical trends becomes critical.
Detecting ONU Offline Events Across the Network
The first step in troubleshooting is understanding whether the outage is isolated or widespread.
NetSense provides a real-time view of all ONUs in the network and their current status.
ONU Status Distribution
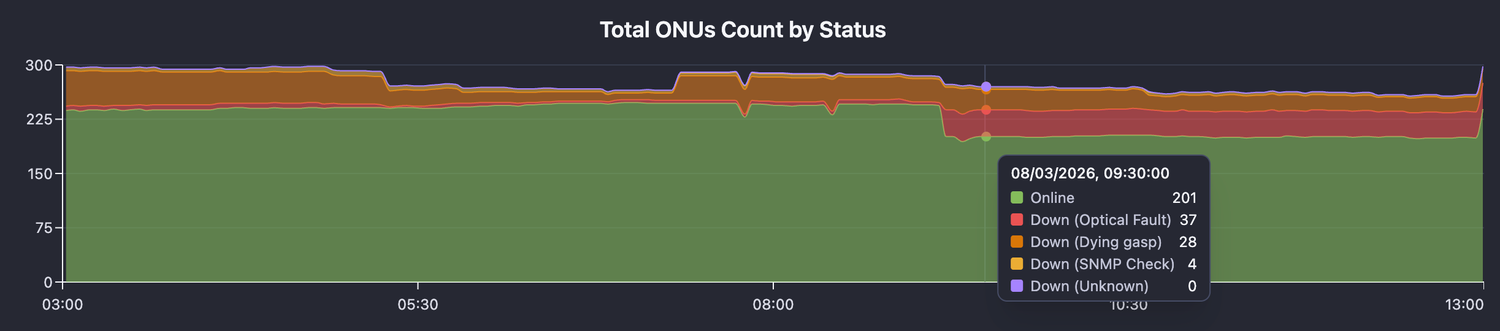
This dashboard shows how many ONUs are online and how many are down, along with the reason.
Operators can quickly detect whether the issue affects one subscriber or hundreds.
For example:
- Large spike in Optical Fault → likely fiber damage
- Large spike in Dying Gasp → power outage in an area
This allows NOC teams to prioritize incidents correctly.
Troubleshooting a Specific ONU
Once a specific ONU is identified as offline, operators need detailed telemetry to understand the root cause.
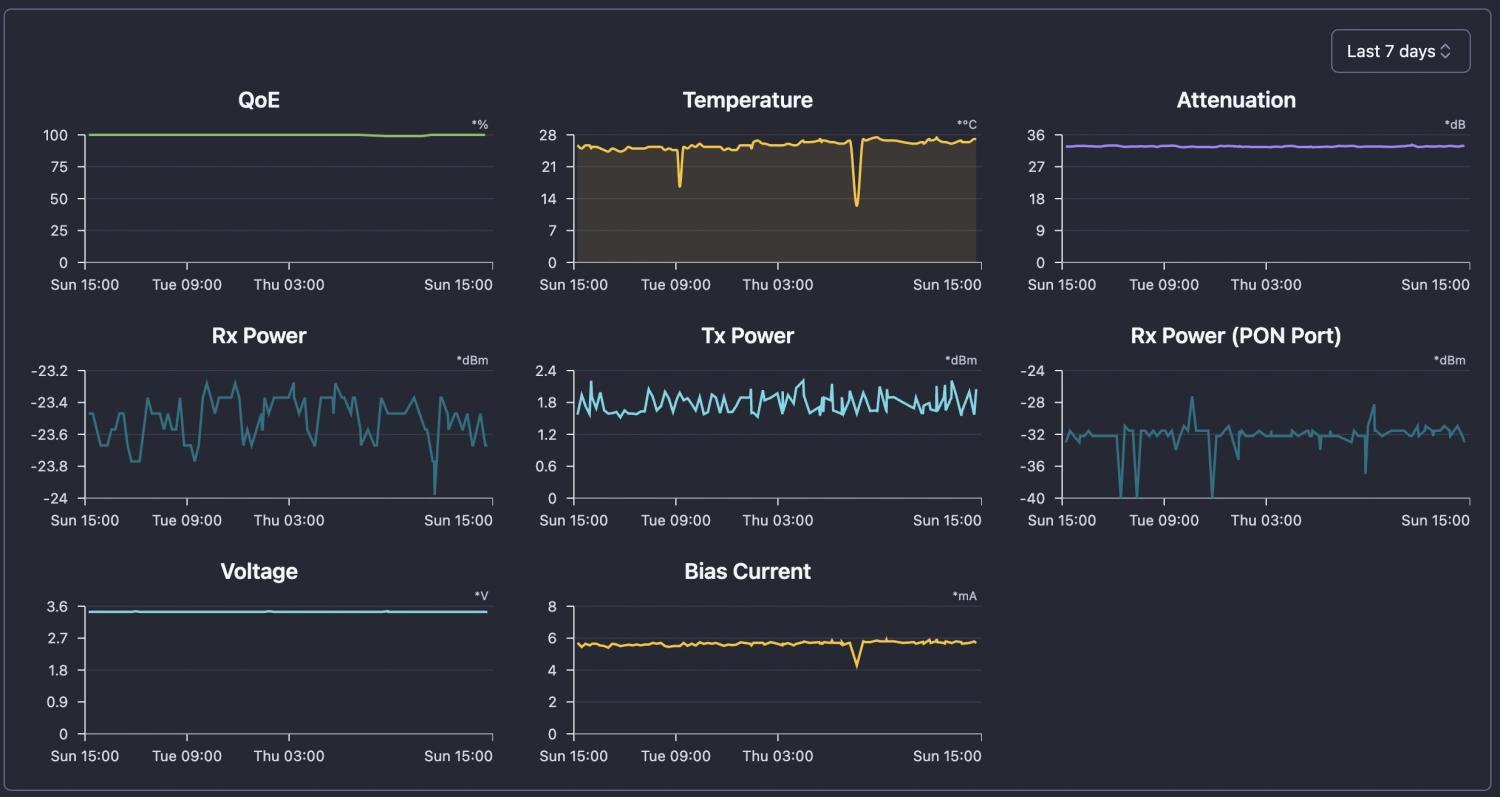
ONU Diagnostics View
Key information available in NetSense includes:
- OLT hostname and PON port
- ONU ID and location
- Optical signal levels
- Distance from the OLT
- Temperature
- Laser bias current
- Voltage
These metrics help quickly determine whether the issue is power, fiber quality, or hardware related.
Using Optical Metrics to Identify Link Problems
Optical telemetry is one of the most valuable signals when diagnosing ONU issues.
NetSense continuously collects optical data such as:
- ONU RX Power
- ONU TX Power
- OLT RX Power
- OLT TX Power
- Optical attenuation
- Temperature
- Bias current
These metrics provide immediate clues.
Sudden Optical Power Drop
Often indicates:
- Fiber cut
- Connector damage
- Accidental cable removal
Gradual RX Power Degradation
Usually suggests:
- Aging connectors
- Fiber bending or stress
- Splitter degradation
- Environmental factors
Because NetSense stores historical optical telemetry, operators can see exactly when degradation started and whether it happened suddenly or gradually.
This makes it possible to identify problems such as:
- Slowly deteriorating fiber links
- Dying ONU lasers
- Aging optical components
Identifying Partial PON Failures
A common operational challenge in PON networks is detecting partial fiber outages.
Sometimes the entire PON port goes down.
This is easy to detect and most tools do it.
But many real-world failures are partial.
Examples:
- One secondary splitter cut
- Damage to fiber trunk (main cable, connecting to multiple secondary splitters)
In these cases:
- The PON port remains UP
- Only a subset of ONUs go offline
NetSense detects this scenario as Partial PON Down.
Typical pattern:
- Multiple ONUs on the same PON port
- All reporting Optical Fault
- Occurring at roughly the same time
This strongly indicates a fiber problem in the distribution network, not a customer-side issue.
Detecting this pattern allows operators to:
- Dispatch technicians immediately
- Avoid wasting time troubleshooting individual customers
- Restore service faster for multiple subscribers
Understanding Historical ONU Behavior
Current status is useful, but history tells the real story.
NetSense records every ONU state change and downtime event.
ONU Downtime History
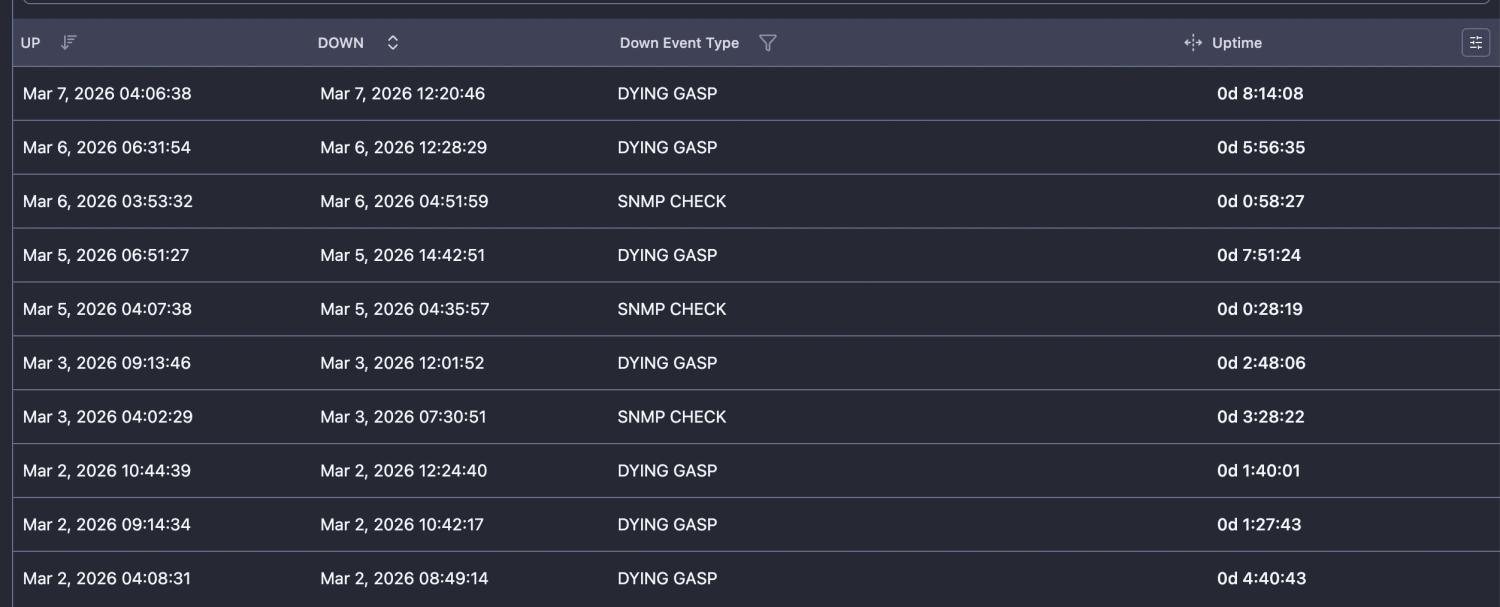
Operators can see:
- Exact timestamps of outages
- The type of outage
- Duration
- Recovery time
This allows operators to identify patterns such as:
- Frequent power losses
- Recurring fiber instability
- ONU hardware problems
Measuring ONU Availability
Another useful metric is availability over time.
NetSense calculates availability for different time periods:
- Last 24 hours
- Last 7 days
- Last 30 days
If an ONU shows:
- 100% availability today
- 80% availability over the past week
it clearly indicates intermittent instability.
This is often caused by:
- unstable power supply
- faulty ONU hardware
- damaged fiber
Analyzing Network-Wide Failure Patterns
Beyond individual ONUs, it’s important to understand why outages happen across the network.
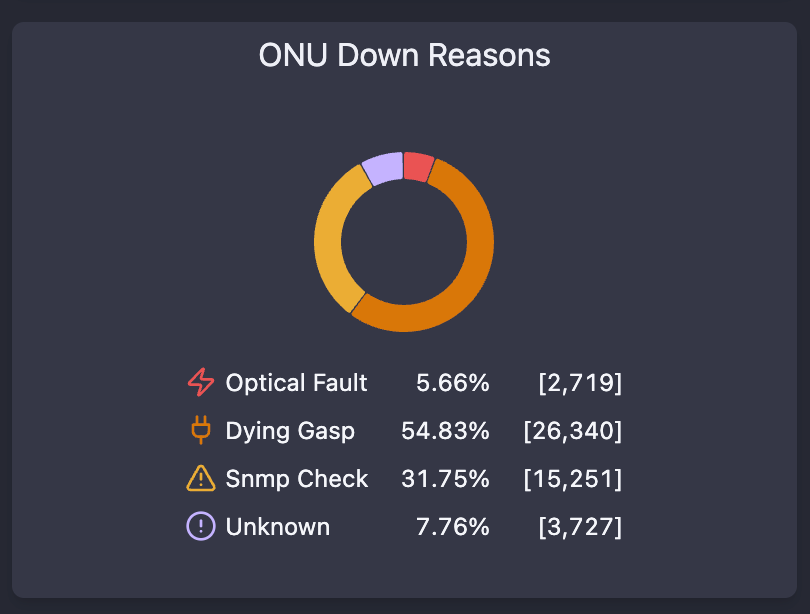
ONU Down Reasons
This view helps operators understand:
- What percentage of outages are power related
- How many are caused by optical problems
- Whether there are systemic issues in the network
Over time this data helps improve operations by identifying:
- weak infrastructure areas
- problematic equipment models
- locations with unstable power
Reducing Mean Time to Resolution (MTTR)
Without proper observability, diagnosing ONU outages often requires:
- CLI access to OLTs
- manual signal checks
- multiple systems
With NetSense NMS operators get:
- instant visibility into outage reasons
- optical telemetry in one place
- historical link behavior
- PON-level failure detection
Instead of spending 20 minutes diagnosing a single outage, operators can determine the root cause in seconds.
This dramatically reduces:
- troubleshooting time
- field visits
- customer downtime
End-to-End Visibility for the Last Mile
In many ISP networks, the last mile remains a blind spot.
Yet this is exactly where most customer problems occur.
NetSense NMS focuses on giving operators visibility into:
- OLT health
- PON port performance
- ONU behavior
- subscriber quality of experience
By combining monitoring, telemetry, and historical analytics, operators gain the insight needed to diagnose and resolve access network issues faster.
Frequently Asked Questions
- What are the most common reasons an ONU goes offline?
- In GPON/EPON networks, ONU offline events fall into three categories: a dying gasp (the ONU lost power - customer unplugged it, a local power outage, or a faulty adapter), an optical fault (a physical fiber problem like a broken drop fiber, bad splice, dirty connector, or excessive attenuation), and unknown events where the OLT doesn't report a clear reason (more common on EPON OLTs). Dying gasp is often the single largest cause of ONU downtime.
- How do you tell a power problem from a fiber problem when an ONU drops?
- Check the down reason and optical metrics. A dying-gasp signal means the ONU lost power at the premises and needs no field visit. An optical fault - or a sudden drop in ONU RX power - points to a fiber issue (cut, connector damage, cable removal) that needs a technician. A gradual RX-power decline instead suggests aging connectors, fiber bending/stress, or splitter degradation.
- How do you know if an ONU outage is isolated or a wider network problem?
- Look at ONU status distribution across the network, not one device. A spike in optical-fault ONUs on the same PON or area usually means fiber damage; a spike in dying-gasp ONUs points to an area power outage. This lets NOC teams separate a single-subscriber fault from a mass outage and prioritize correctly.
- What telemetry do you need to troubleshoot a specific offline ONU?
- Useful per-ONU diagnostics include the OLT hostname and PON port, ONU ID and location, optical signal levels (ONU Rx power/OLT RX and TX power), distance from the OLT, temperature, laser bias current, and voltage - together they show whether the issue is power, fiber quality, or hardware.
- How does historical optical telemetry speed up troubleshooting?
- Stored optical history shows exactly when a link began degrading and whether it failed suddenly or gradually - distinguishing a fiber cut from a slowly dying ONU laser or aging components - which cuts MTTR because you're not guessing at the root cause.