Changelog
Stay up to date with the latest features, improvements, and bug fixes.
43 releases in the last 12 months
Less
More
Aug
Sep
Oct
Nov
Dec
Jan
Feb
Mar
Apr
May
Jun
Jul
June 23, 2026
Enhancements
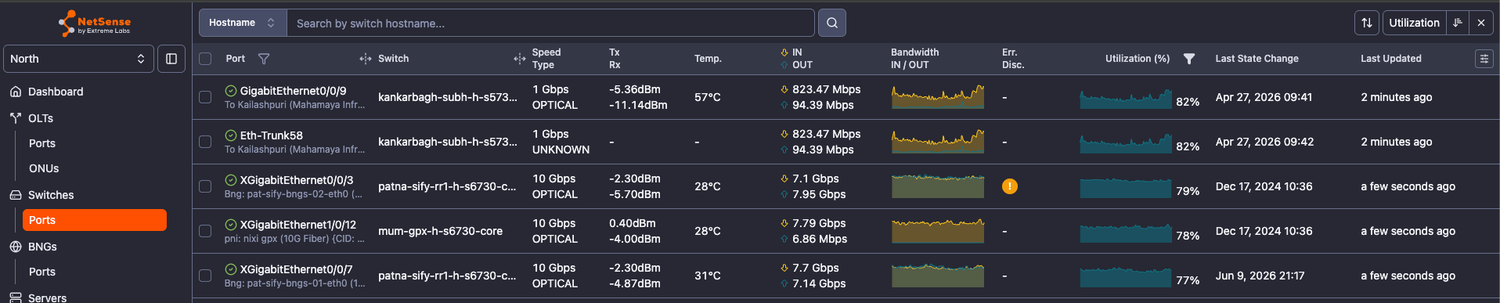
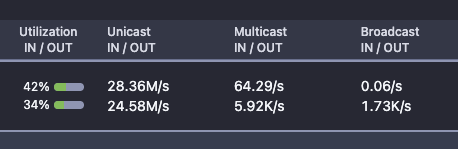
- Updated UI and data in all “Ports” sections: OLT/Switch/BNG/Server
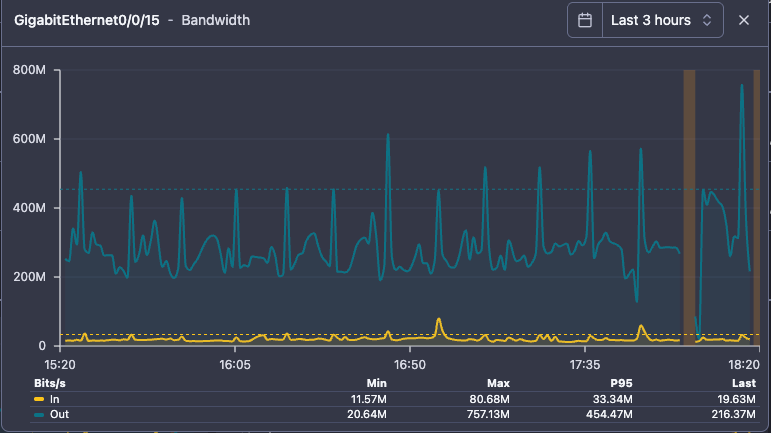
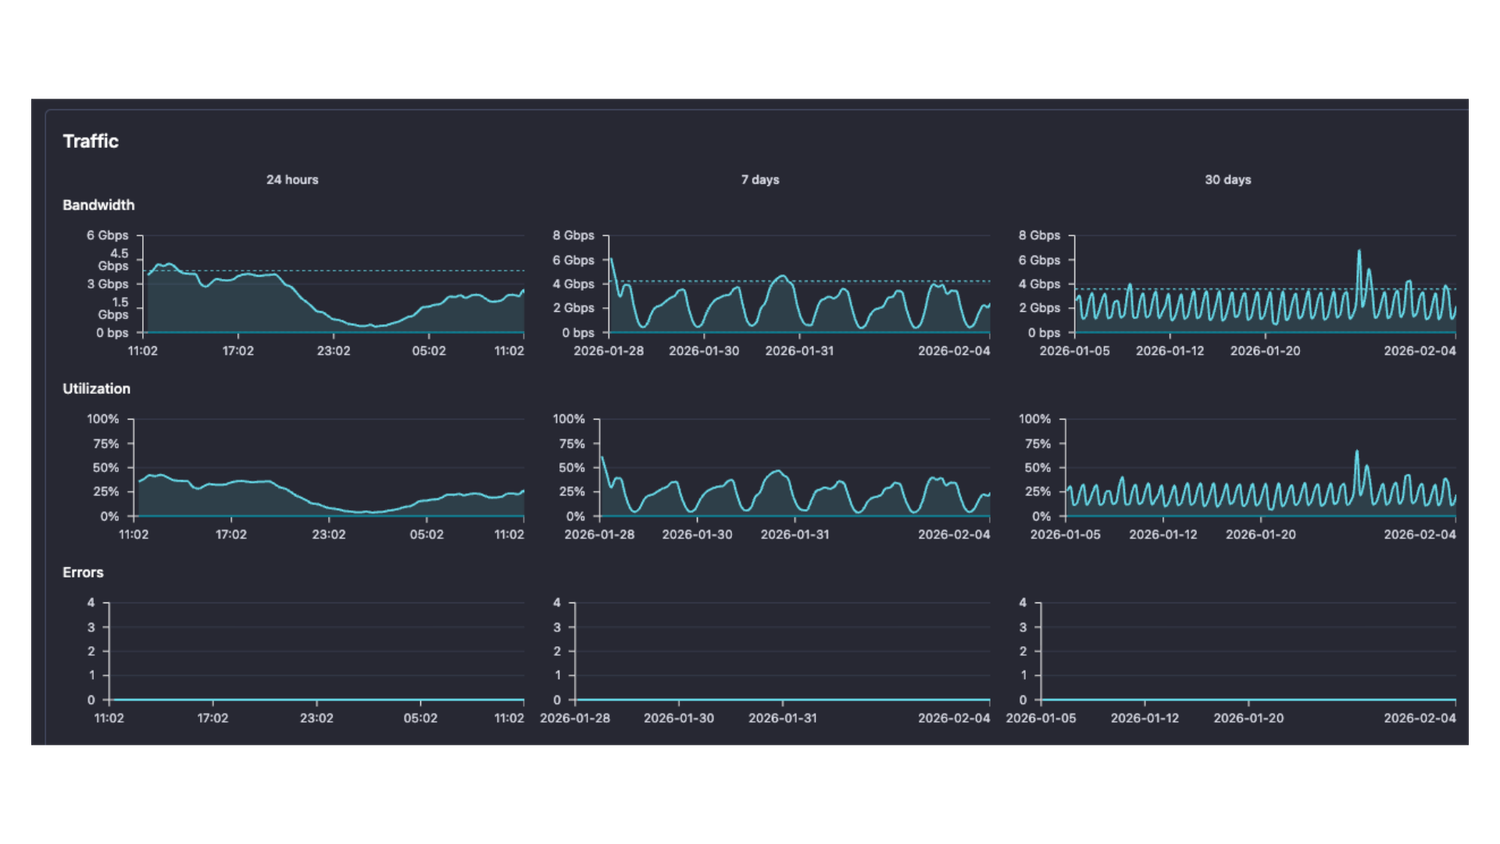
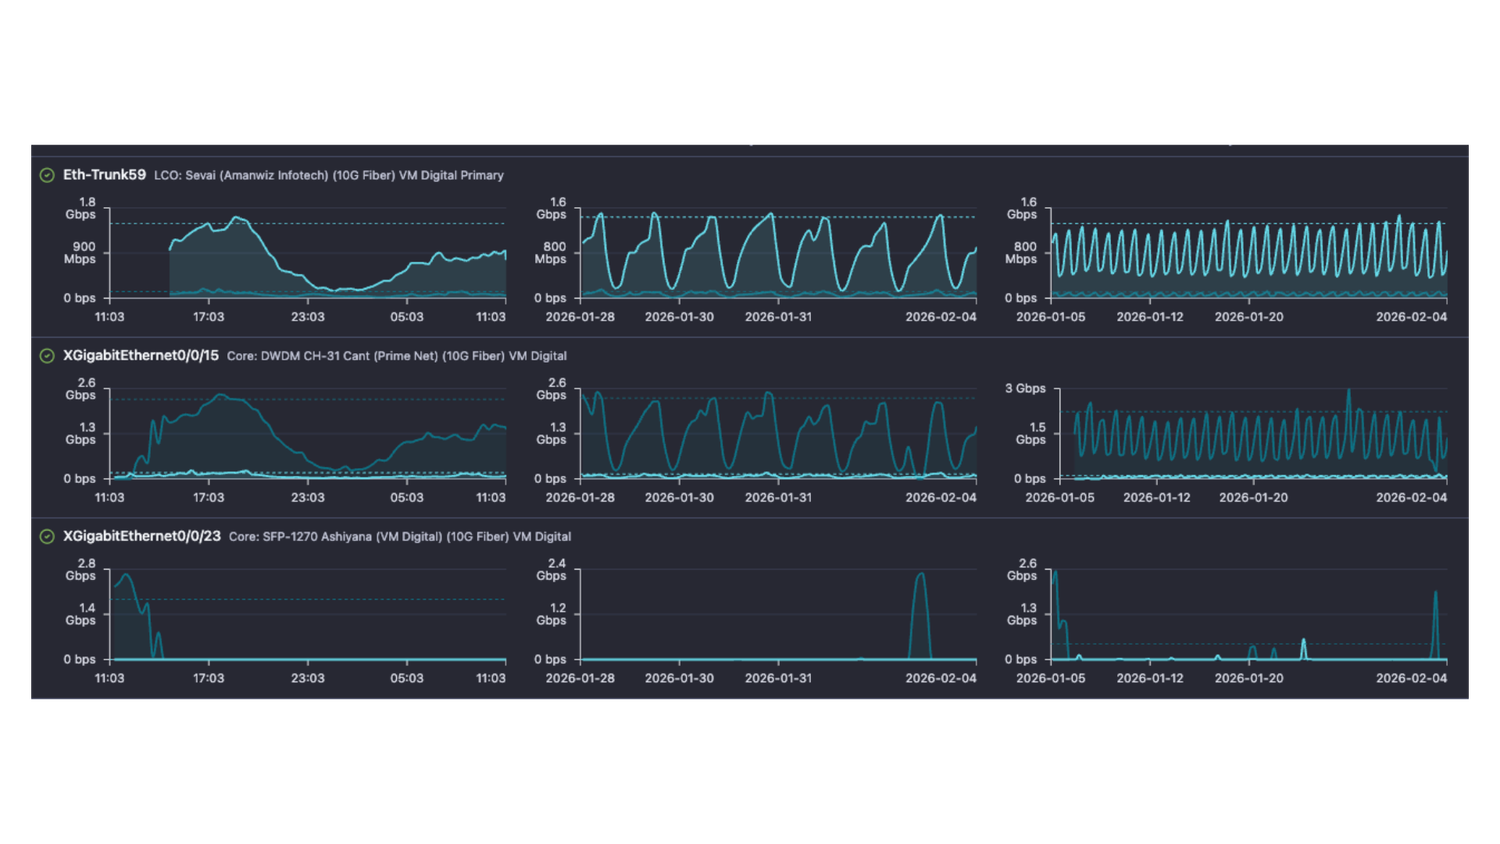
- Spark area charts for traffic and utilization
- Added information about errors and discards
- Updated visualization for the IN/OUT last values
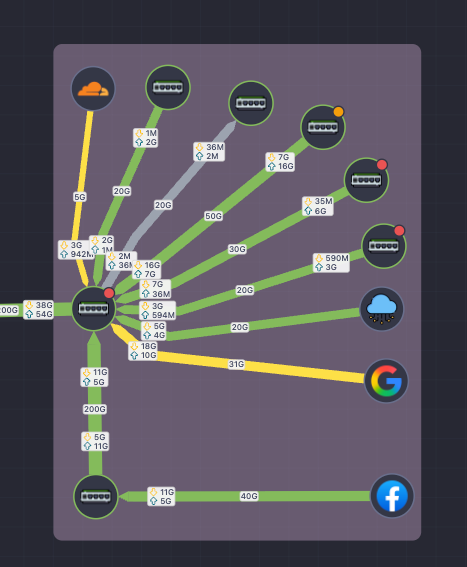
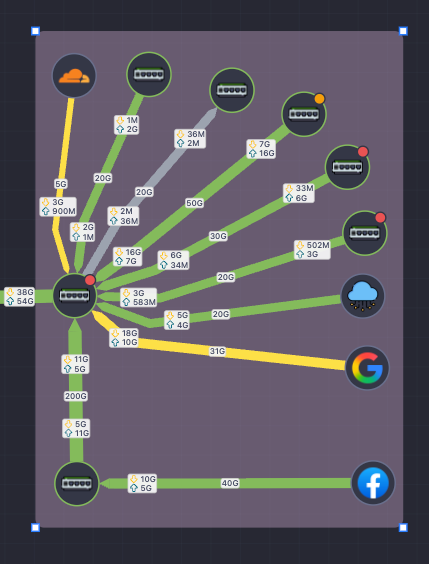
- Draggable in/out traffic metrics on network map links - A perfect match to the flexible link, draggable in/out traffic balloons gives the ability to optimize information visualization on the map; Especially useful in very congested maps with a lot of links
- Enhanced UI/UX on Port details view and port single parameter multi-view
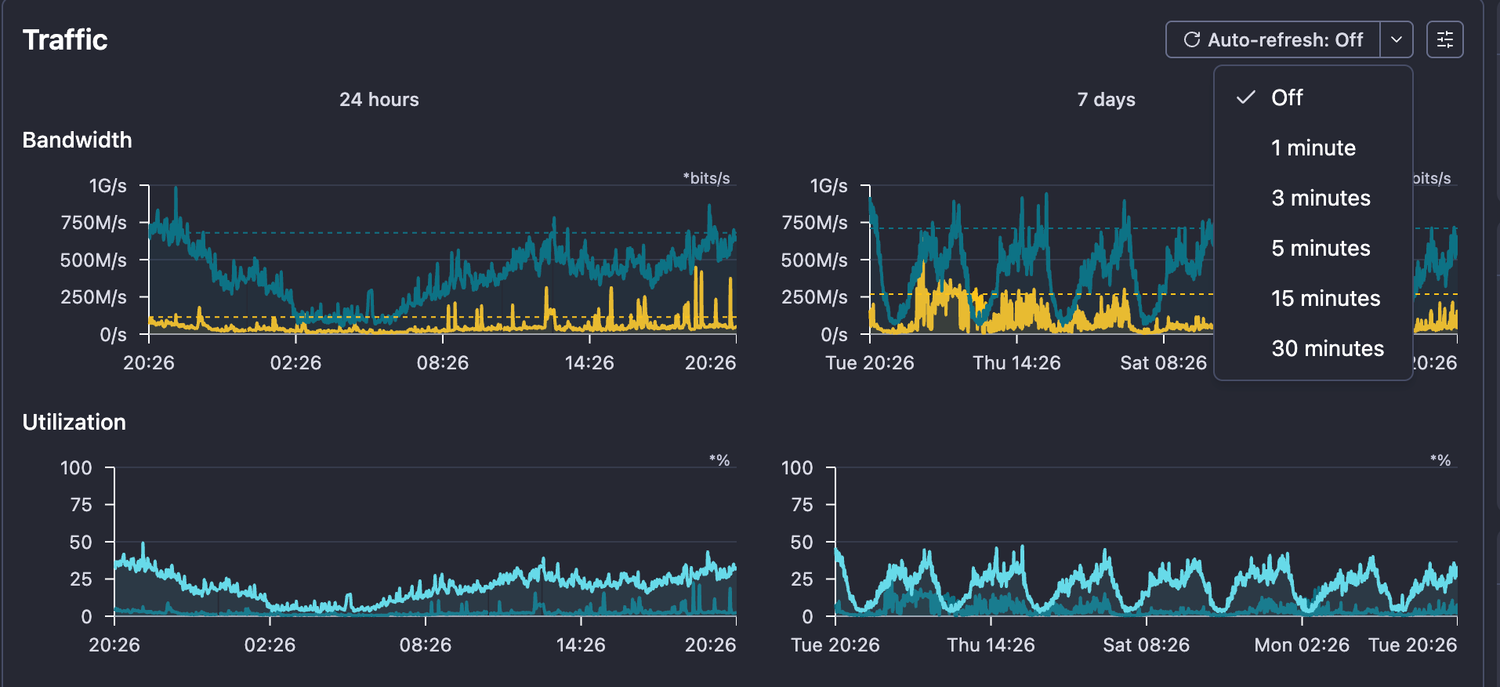
- Page refresh is disabled by default
- Auto-refresh interval can be set from the presets drop-down menu in the upper right corner
- Updated Node consumption report - now it includes BNG and Server ports

June 18, 2026
Enhancements
- Enhanced OLT Polling - introducing polling queue for the OLTs to make the polling more efficient. There are high-priority, normal and low-priority queues which will ensure optimized polling, less stress cpu-heavy SNMP operations and enhanced device stability
- New server parameters - now NetSense provides even more useful information about Linux servers
- OS description
- CPU architecture
- Disk IOPs
- Last rebooted at
Integrations
- Optilink OP-GOLT 72408E OLT
June 11, 2026
Features
- New Alarm Relay - Slack
With this integration and less than 5 min. setup you can configure alarms delivery on slack via Webhooks.

Enhancements
- Added missing parameters to Cisco ASR, Nexus and C4948 integrations
- OLT Poller optimization - added OID caching for some walk operations which don’t change often and don’t return counters - this will speed-up the polling of those devices and reduce the SNMP queries
Bugfixes
- Fixed: False-positive alarms for server CPU/Memory/Disk
June 10, 2026
Features
- Offline ONUs MAC address removal from OLT - ONUs deleted by NetSense housekeeping (inactive more than 14 days) trigger a delete of their MAC address entry from the OLT if NetSense management module is enabled
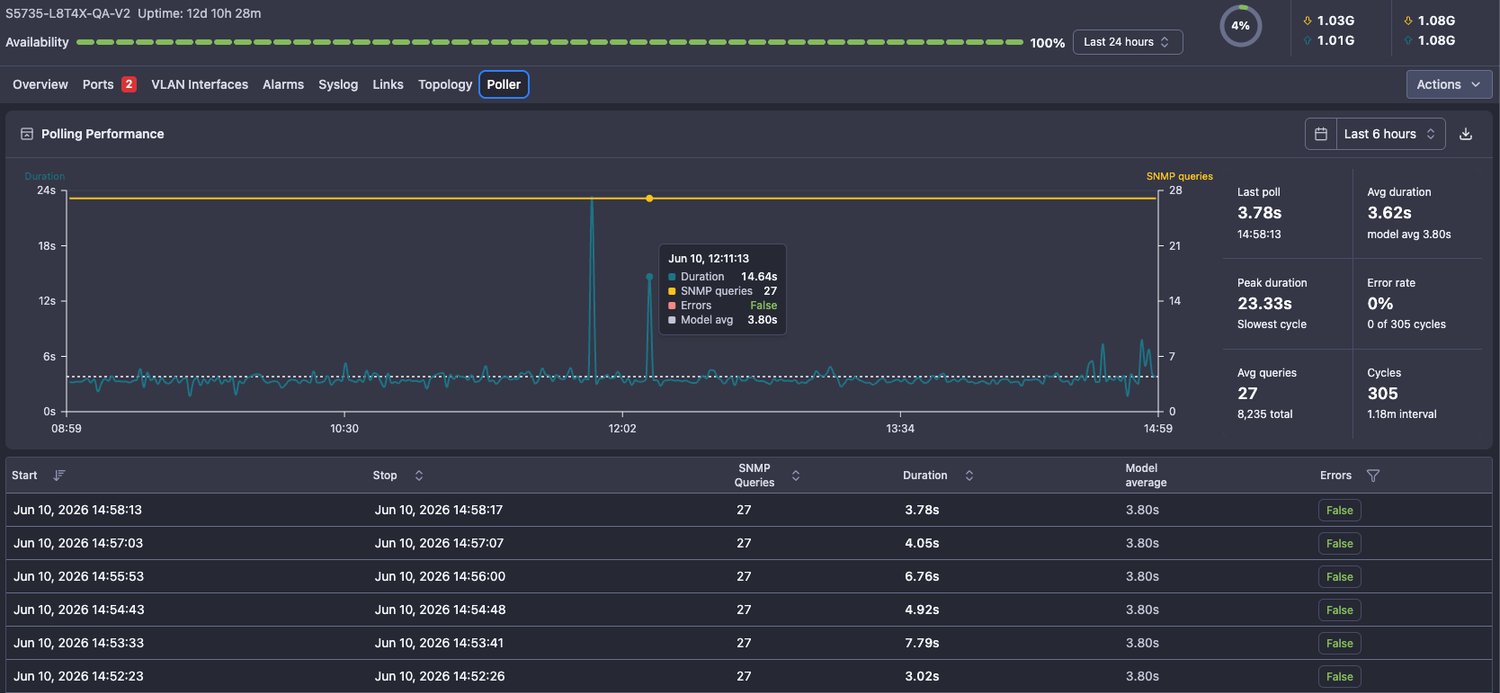
- Device polling statistics - a Poller tab in each device shows how the device performs in terms of polling duration and quality compared to the model average. There are charts for visual understanding and details in table format for deeper analysis
Enhacements
- Added Netbox-NetSense synchronization for Virtual Machines
Integrations
- Cisco ASR 1K
- Cisco Nexus 9K
- Cisco Catalyst 4948
June 8, 2026
Features
- Added ONT bandwidth and packet capture on Huawei OLT models
Enhancements
- Improved calculation of the total traffic utilization on devices - this will provide more accurate data
- Improved UI of the custom dashboard
- Added interface description
- optimized visualization on the 3 and 4 chart grid
- Changed OIDs for errors and discards capture on Mikrotik
- Added CPU names in Server - CPU view

June 2, 2026
Features
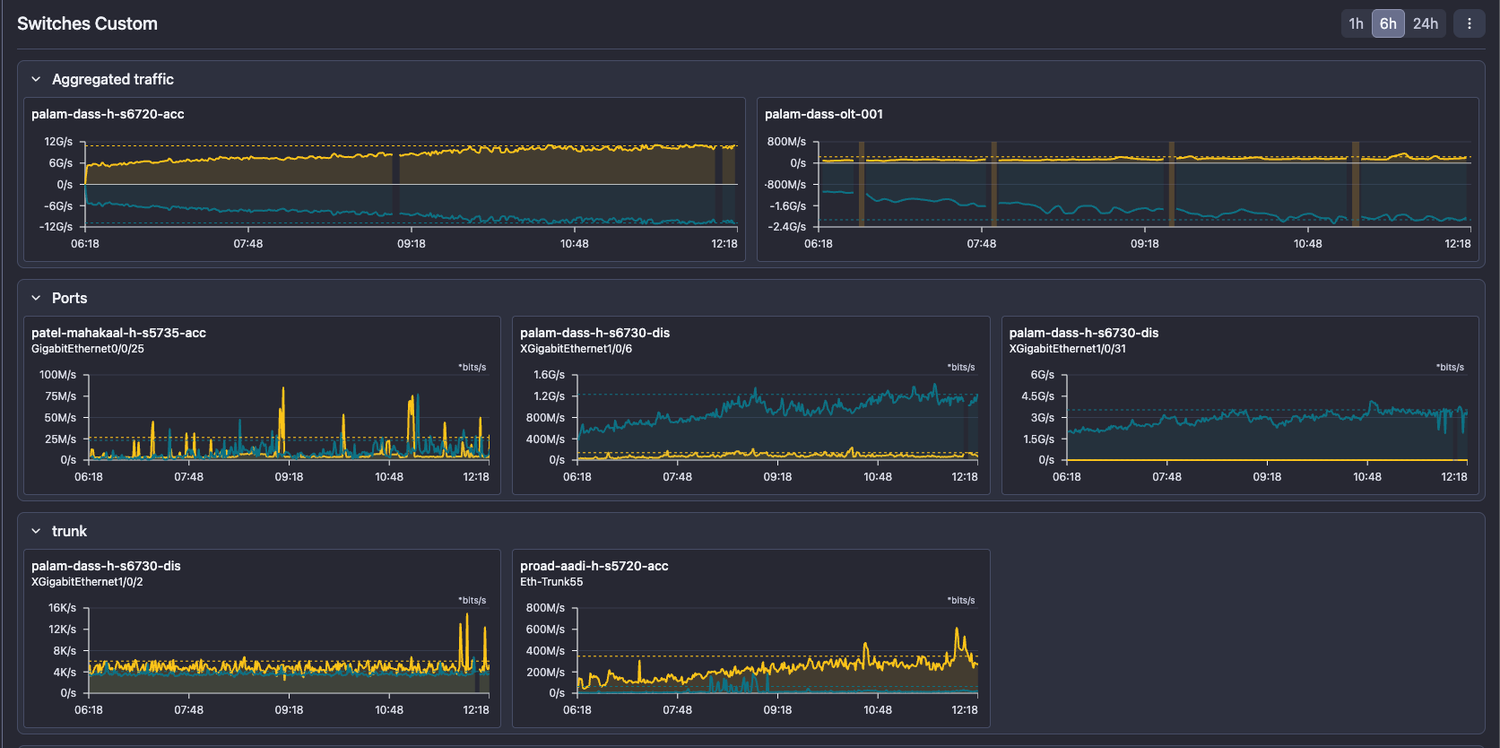
- Custom dashboard - now you can create custom dashboards with bandwidth charts in NetSense - a useful feature if you need a constant monitoring over a specific set of ports, vlans, links or aggregated traffic on an entire device. Charts can be organized into sections for convenience.
- ONU polling queue - each ONU polling requests now is being processed from a queue which optimize the load over the OLTs caused by frequent polling, especially triggered by ONU registration events
Enhancements
- Improved responsiveness on the alarms widget in the dashboard
- Removed shared tooltip between different ports
Bugfixes
- Fixed: ONU data discrepancy caused by case insensitive match
- Fixed: Last data point in charts sometimes shows zero
- Fixed: NetSense UI - not loaded proper .js files on update
May 29, 2026
Enhanements
- Updated BDCOM OLT integration to include
- ONT optical parameters
- Syslog parsing
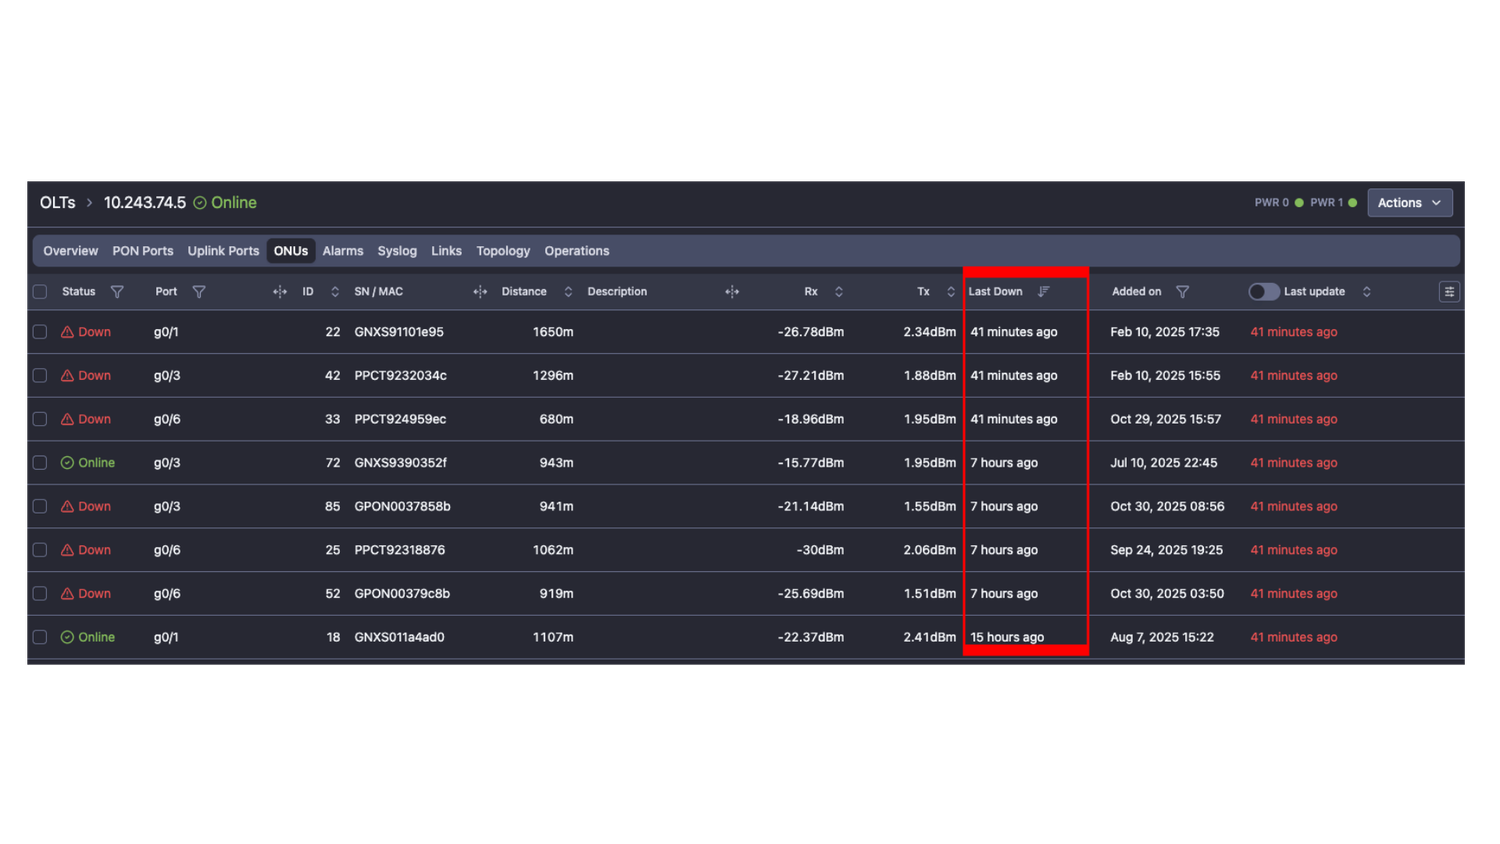
- ONT list can now be sorted by downtime in the Mobile view

May 26, 2026
Features
- BNGs and Servers now has mobile view
Enhancements
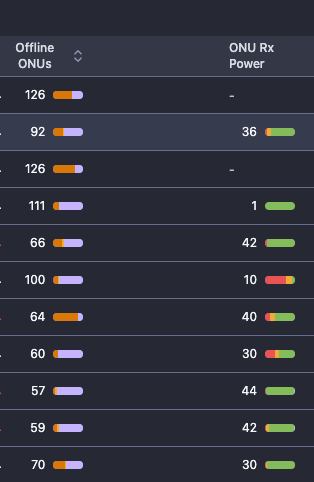
- Offline ONUs and ONU Rx Power distribution are now visible on the main OLT list
- OLT Polling optimization (if during a polling the OLT response timeouts - polling will be terminated
Bugfixes
- Fixed: SFP Rx/Tx power on Juniper QFX5120-32C-AFO
- Fixed: Servers Memory and Disk name visualization
May 23, 2026
Integrations
- Improved BDCOM OLT Integration
May 20, 2026
Features
- Linux Server Monitoring: New type of devices - linux servers are now supported in NetSense.
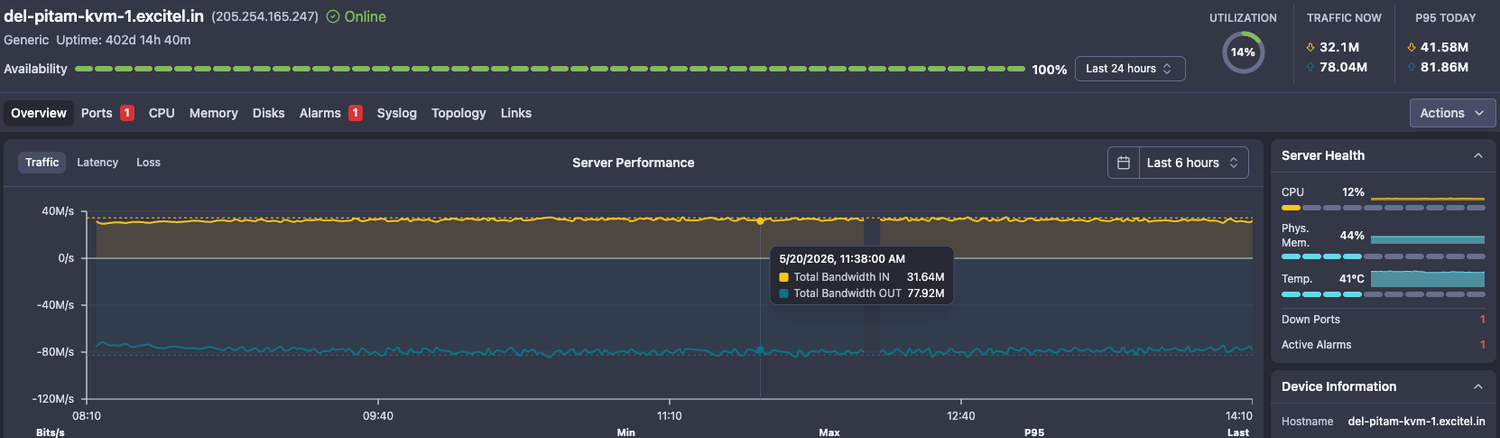
In order to be able to monitor it, you should configure SNMP agent on the server.
The monitoring now includes:
- CPU - Average and separate core
- Memory - Physical and Virtual
- Temperature
- Disks - All mount points found on the server
- Network - all network interfaces
- Syslog - if configured
Alerts for all parameters are available.
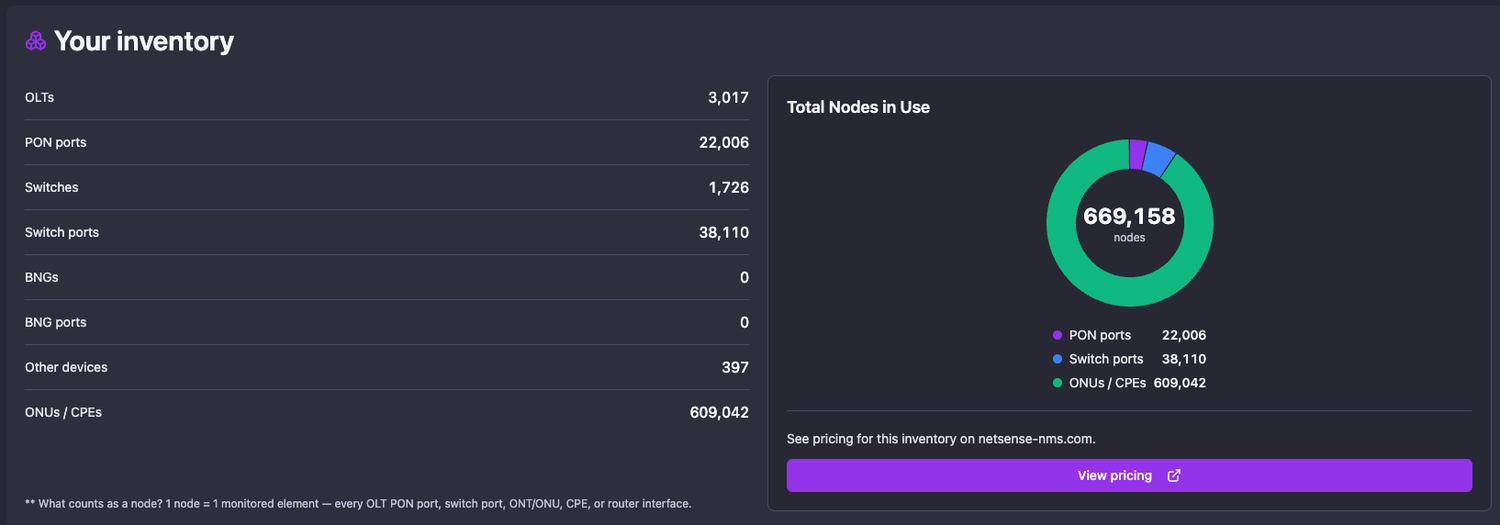
- Node Consumption report - you can check in real time how many ONUs OLTs, Switches, BNGs and ports you have in Netsense.
- Each ONU, PON port or switch port is considered node and a subject to billing
- There is a direct link to a price calculator which would show a price prognosis based on the current node consumption
Integrations
- BDCOM OLT, models
- P36XX, EPON
- GP3600, GPON
- Antriksh (BDCOM Chip)
- A1978-A08, GPON
May 14, 2026
Features
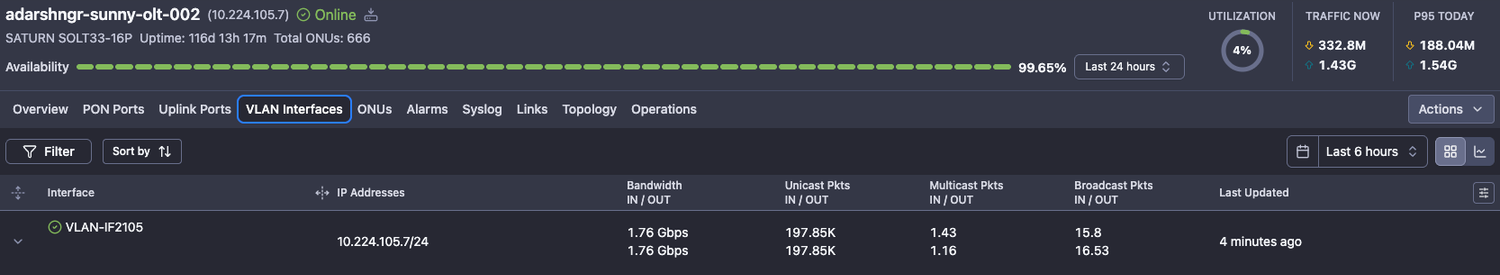
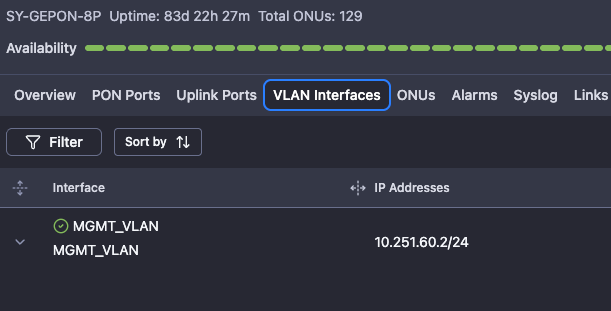
- OLT VLAN Interfaces are being visualized in NetSense and performance parameters such as status, assigned IP addresses, traffic, packets, etc. are collected and visualized
Enhancements
- VSOL OLT polling template has been fine-tuned for better performance
- Network MAP capacity visualization and coloring
- New default color (black/purple stripes) for links which speed is undetermined and utilization cannot be calculated
May 12, 2026
Enhancements
- Improved SNMP queries batching in polling
- Added a visual indicator for links on the MAPs which does not report speed and utilization cannot be calculated.
Such links are colored in purple/black and have a tooltip indicating that speed cannot be determined

May 5, 2026
Features
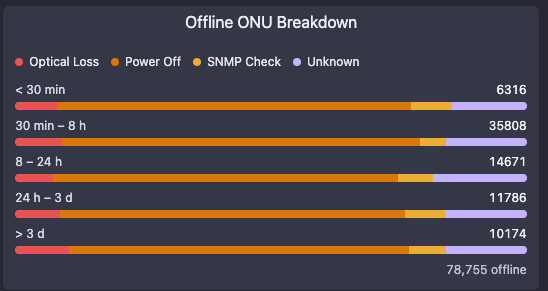
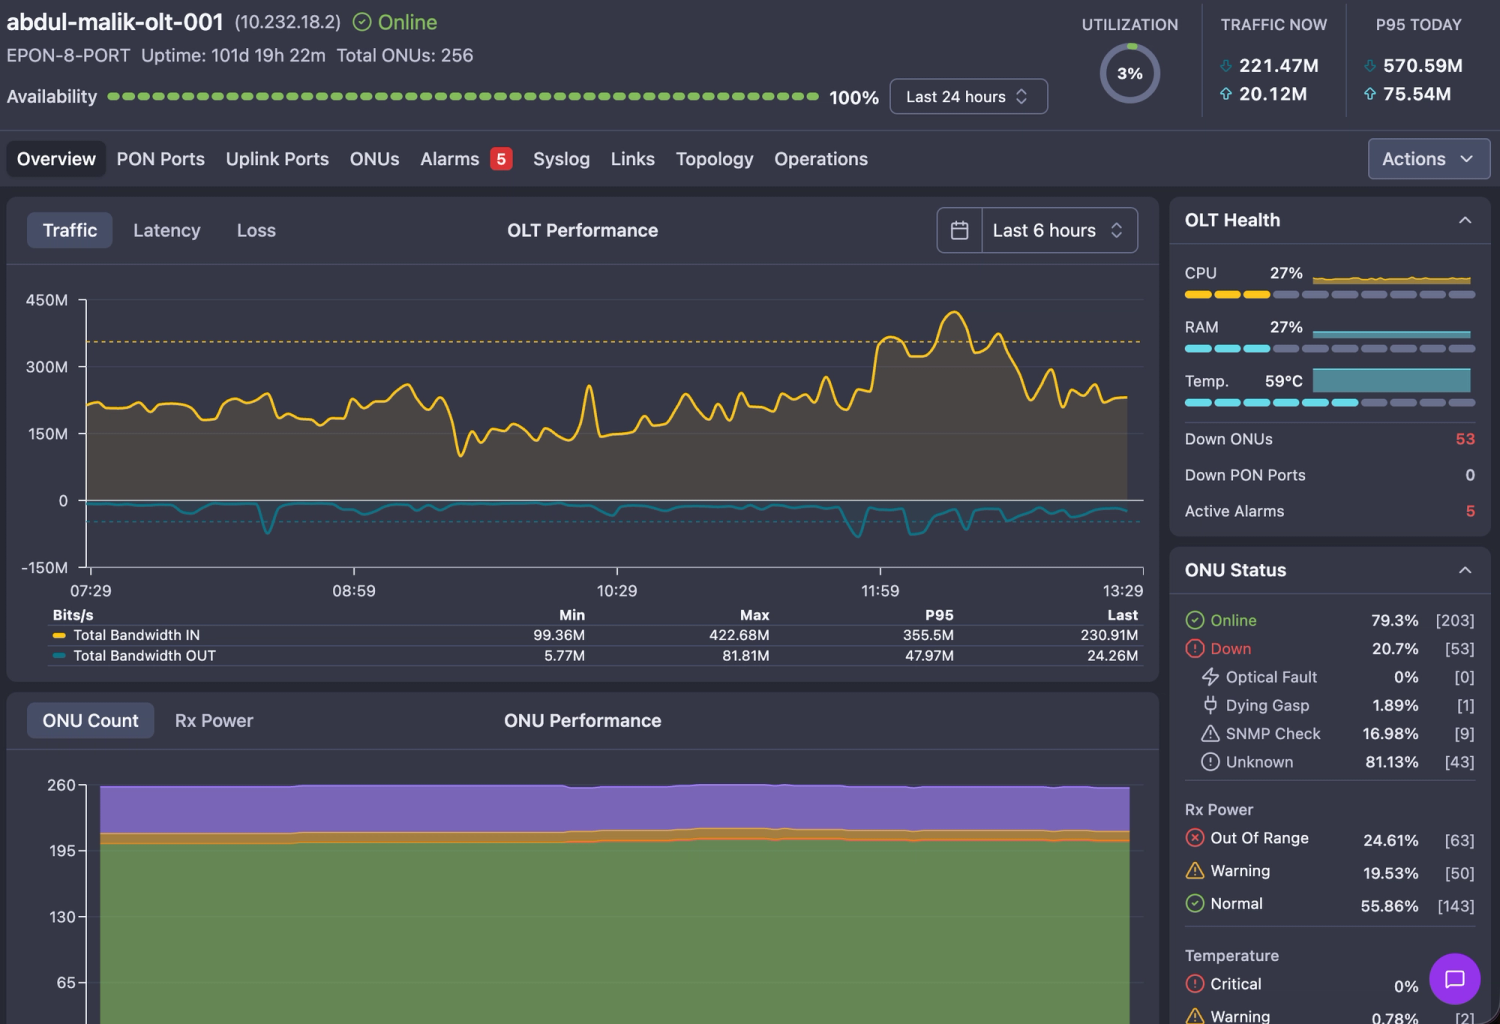
- New Dashboard and OLT overview widget for Offline ONUs breakdown by time and reason
This view gives a holistic understanding about the reason why the ONUs are down and for how long
Enhancements
- Support for Netbox version 4.5
April 28, 2026
Features
- OLT ports “enable” and “disable” operations
- Bulk upload of devices in NetSense
- Navigate to Inventory - devices
- Click on “Upload devices” button
- Download the template
- Fill and upload
- Added Unicast, Multicast and Broadcast packets on switch ports
- Added OLT VLAN Interfaces
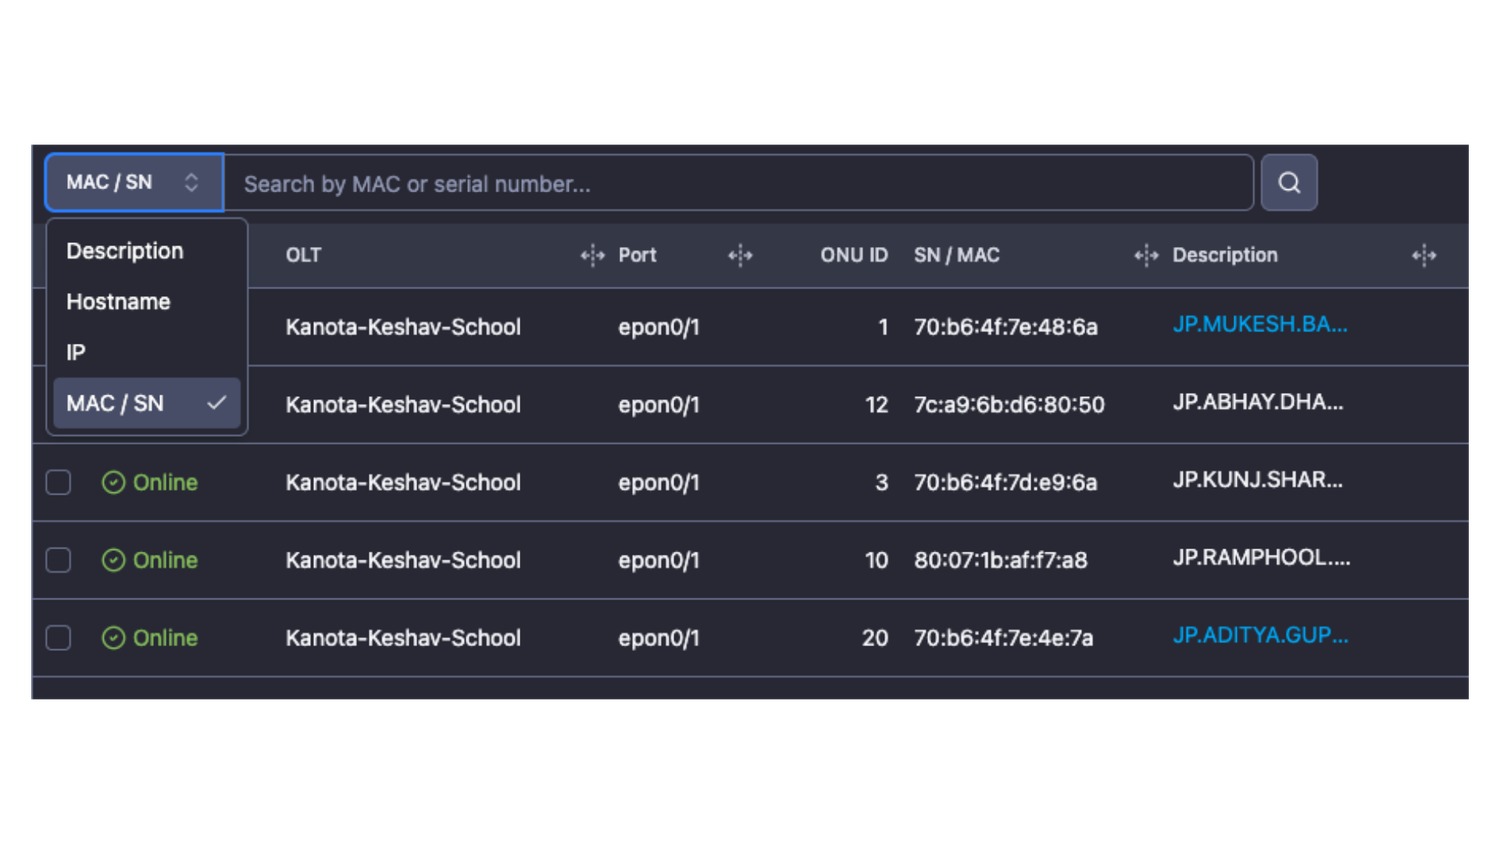
- Search by ONU Description on Mobile
Enhancements
- Device and Down Port events are visualized in the Network MAP link tooltip as annotations
- Optimized device availability widget - visualized the total availability and uptime for each time slot
- Optimized and more informational message for empty dashboard
Bugfixes
- Fixed: ONU reboot operation for Optilink 9702 fails sometimes
April 16, 2026
Features
- Chart annotations - they give immediate information for the identified gaps in the charts, saving further digging and troubleshooting:
- Device down annotation: If a device was down for a certain period of time, the gap in the charts will have a red background and a detailed description in a tooltip
- Device down annotation: If a device was down for a certain period of time, the gap in the charts will have a red background and a detailed description in a tooltip
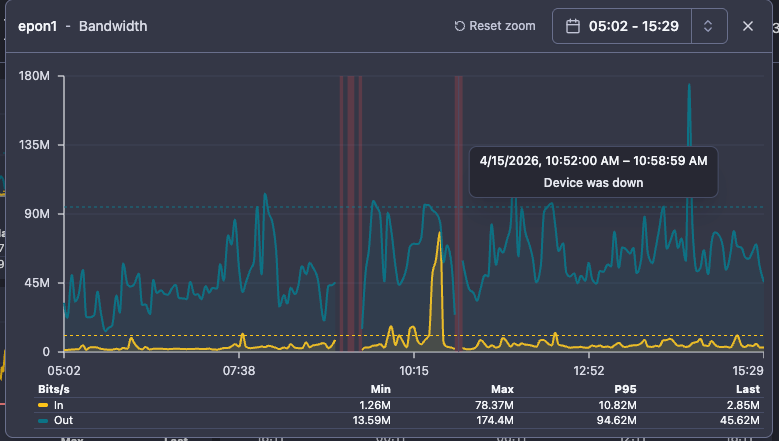
- Port DOWN annotation: if a port was down for a certain period of time, the gap in the charts will have a yellow background and appropriate description in tooltip
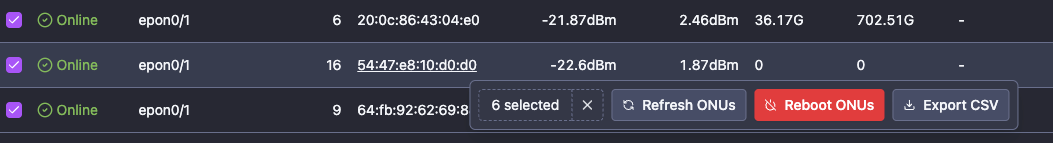
- Bulk ONU reboot from OLT device page/ onus tab - if you want to reboot multiple ONUs at once, you can select them in the UI and use the action “Reboot ONUs”. It doesn’t matter if they are connected to the same OLT.
- ONU packets are being visualized and stored in TS format - a good addition to the traffic capture and visualization
Enhancements
- BREAKING CHANGE: SNMP Counters for Huawei switches have been changed to use IF-MIB OIDs instead of Huawei’s own enterprise OIDs.
If anybody has experience unusual spikes or dips in the traffic, please contact us to advice what configuration must be deployed on the switches with the issues. - Errors and discards on the interfaces are visualized per second instead of deltas
- Power-related PSU has been renamed to PWR for clarity
- ONU details and Port details pages were redesigned - the new design match the OLT/Switch/BNG Overview page which is simplified and with bigger charts
- Left-click-drag-to-zoom in all charts on web view
- Entity information has been added to Alarm reports
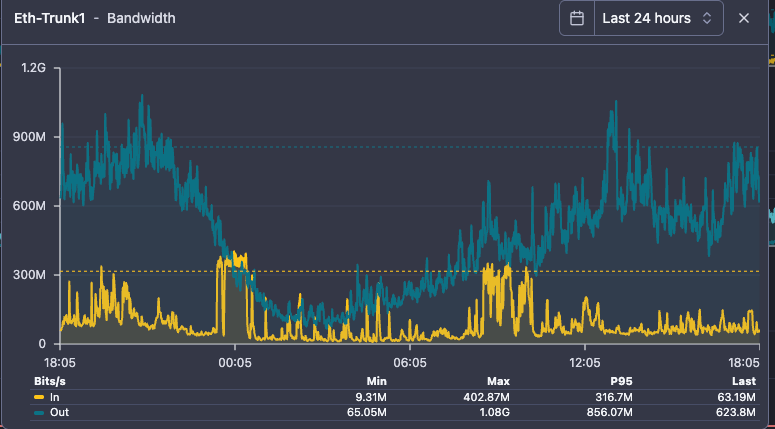
- Charts bandwidth colors have been changed to Yellow and Dark Blue for better contrast
- Network MAP enhancements
- Smoother zoom in/out
- Headless view (Fullscreen)
- Manual ordering of the MAPs in the sidebar menu - currently they are ordered by date of creation
- Added 500 ms delay for the tooltip (traffic chart) pop-up when hovering over a link
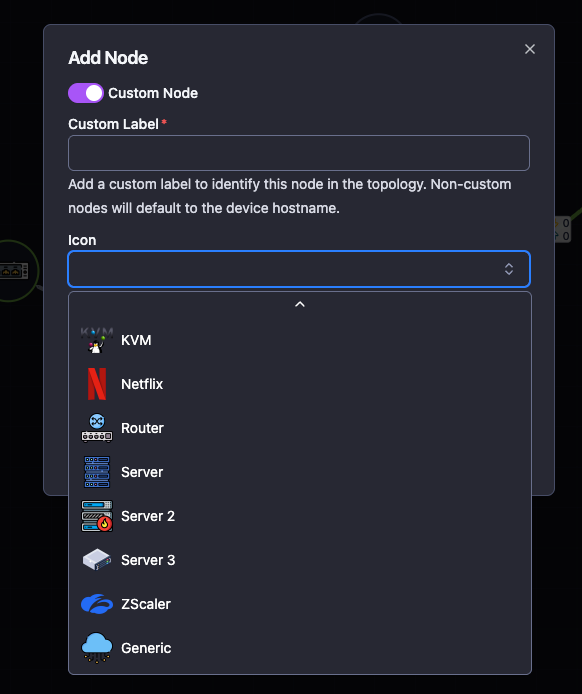
- New batch of custom node icons
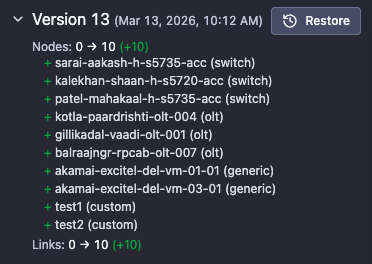
- MAP versions diff
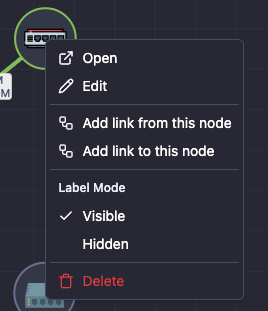
- Add nodes with right click; Add link to/from a node with right click
Integrations
- Cisco SG350-28 switch
March 27, 2026
Features
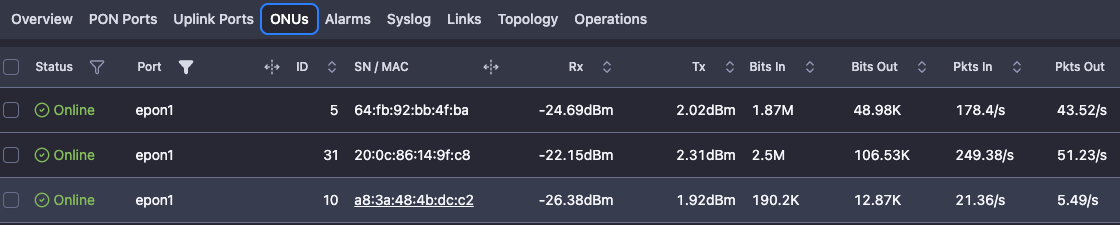
- ONT traffic statistics - NetSense is now able to capture traffic statistics on the PON interface of the ONTs (on the supported OLT models)
- Live traffic statistics are also implemented with 3 different interval options - 20, 40 and 60 seconds

March 26, 2026
Features
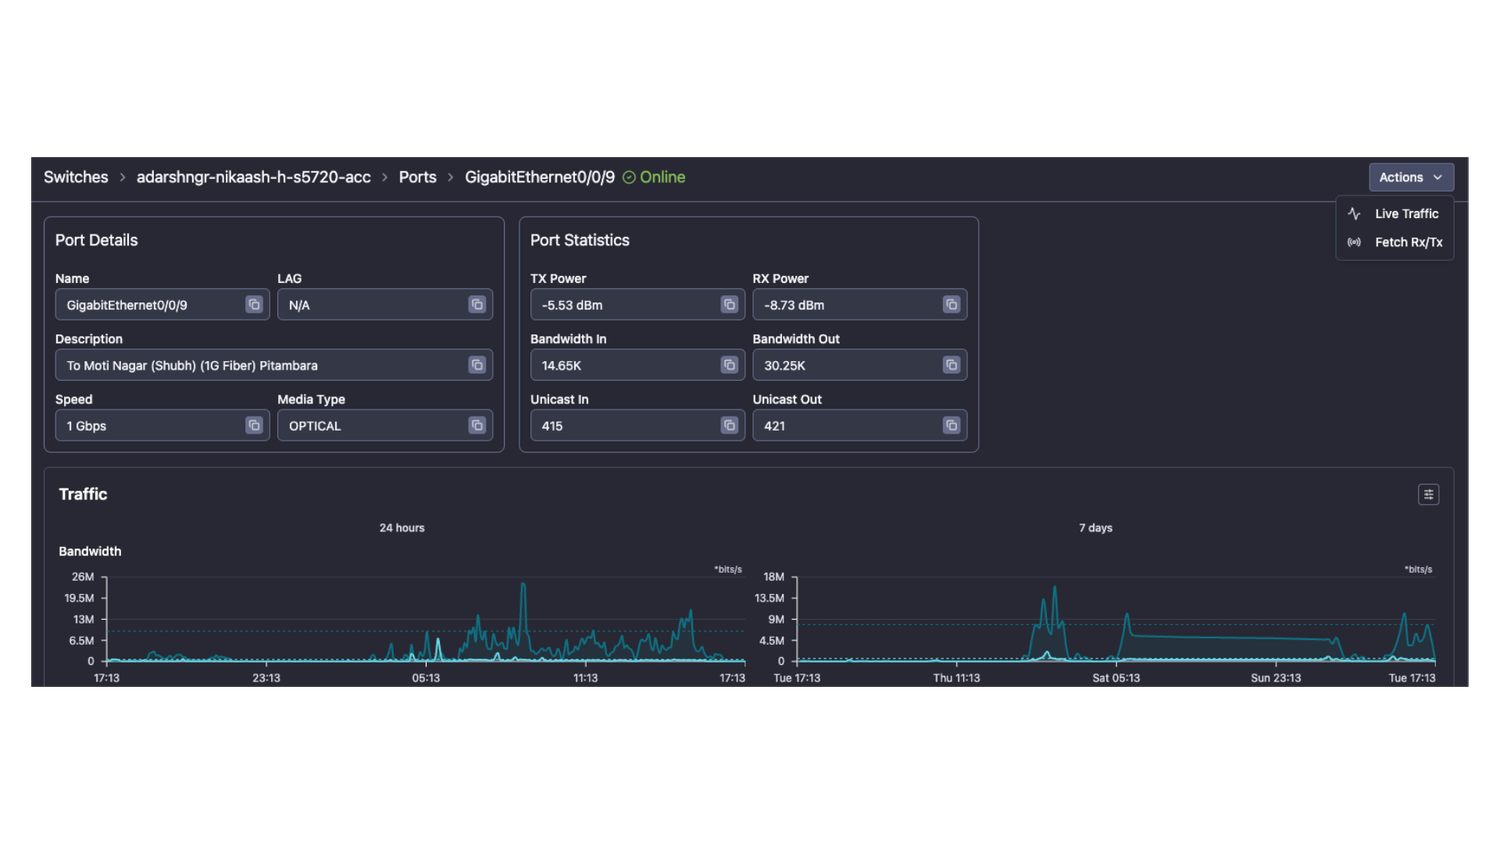
- Port availability widget in the detailed port view - a visual representation of the availability of a port, similar to OLT/Switch/BNG availability; There are charts for last 24 hours, last 7 days and last 30 days

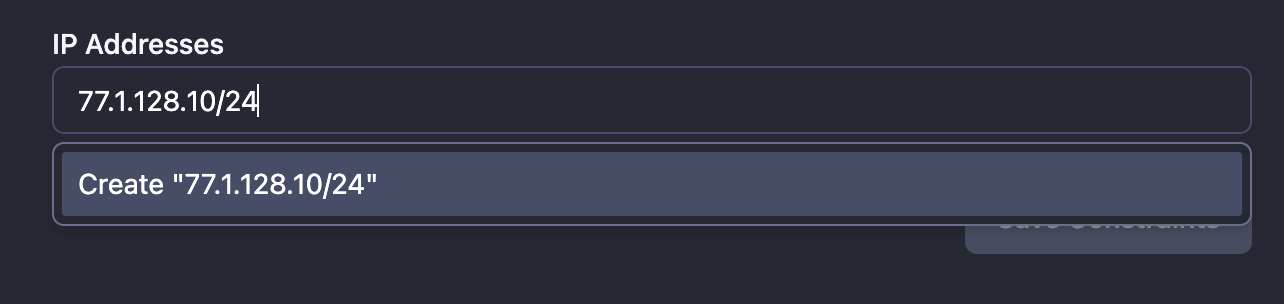
- Limit the logging in NetSense by IP address or subnet - this enhances security posture and give you more control
Enhancements
- We have changed the ONU down reasons for more clarity;
- Dying Gasp → Power Off
- Optical Fault → Optical Loss
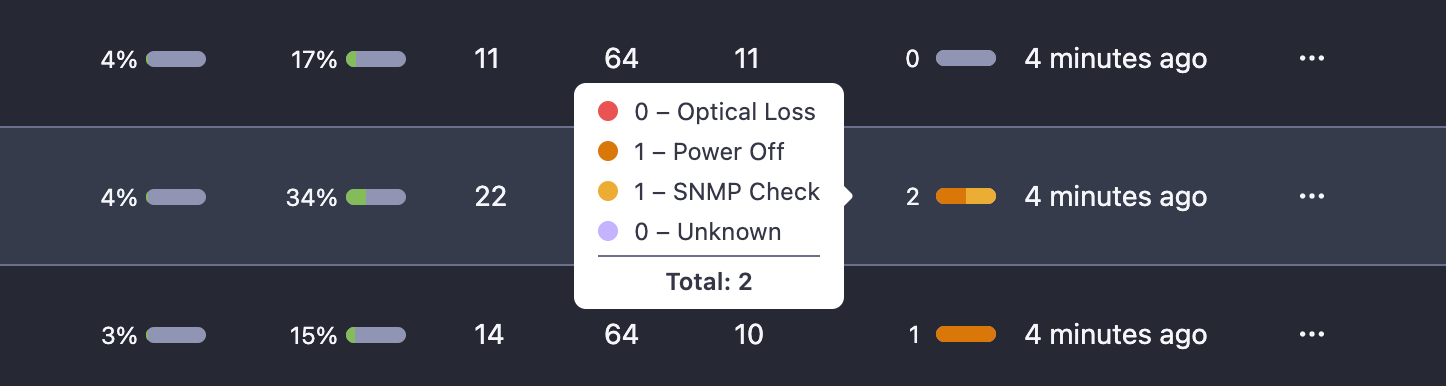
- Enhanced capture of the actual ONU down reason for the supported OLT models with SNMP; In case that ONU down reason has been missed from Syslog, NetSense uses SNMP to determine the real reason for the ONU offline status - giving more clarity to the users and enhances troubleshooting
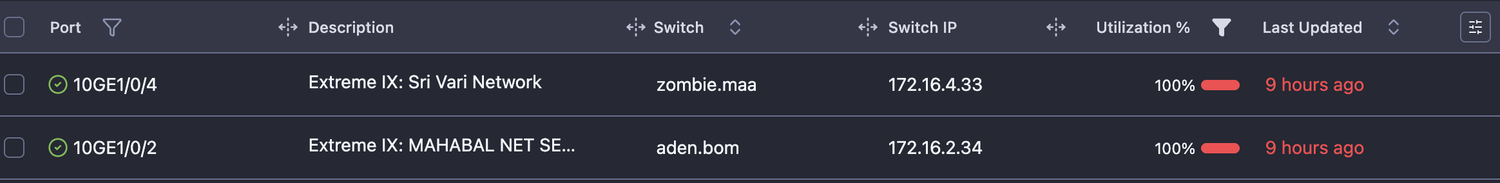
- Added traffic utilization information in Switches - Ports table
- Added information about VLAN interfaces /IP sub interfaces in EdgeCore and UfiSpace switch models (OcNOS)
Integrations
- The following ZyXel switch models have been integrated:
- ES3500-8PD
- GS2210-8
- MES3500-24F
- MGS3520-28
- MGS3750-28F
- XGS4600-32F
March 25, 2026
Enhancements
- Improved authentication flow on login - NetSense now detects if SSO is enabled and suggest all available login options

March 20, 2026
Enhancements
- Redesigned view of the Switch, OLT and BNG Interface - the new look has bigger device health and performance charts, more intuitive widgets and optimized interface providing the user with a holistic understanding about overall device state
- Stacked ports visualization on Huawei S6720 Switch
Bugfixes
- Fixed: Parameters in alarm messages are rounded up to the second decimal
March 16, 2026
Features
- Dynamic Topology MAP
Static/Manual MAPs have their charm as they are well structured, beautiful and visualize exactly what you want to see.
But a dynamic topology map can give you a very detailed understanding about a network segment status without spending time upfront to draw it.
A very useful feature, especially in large networks.
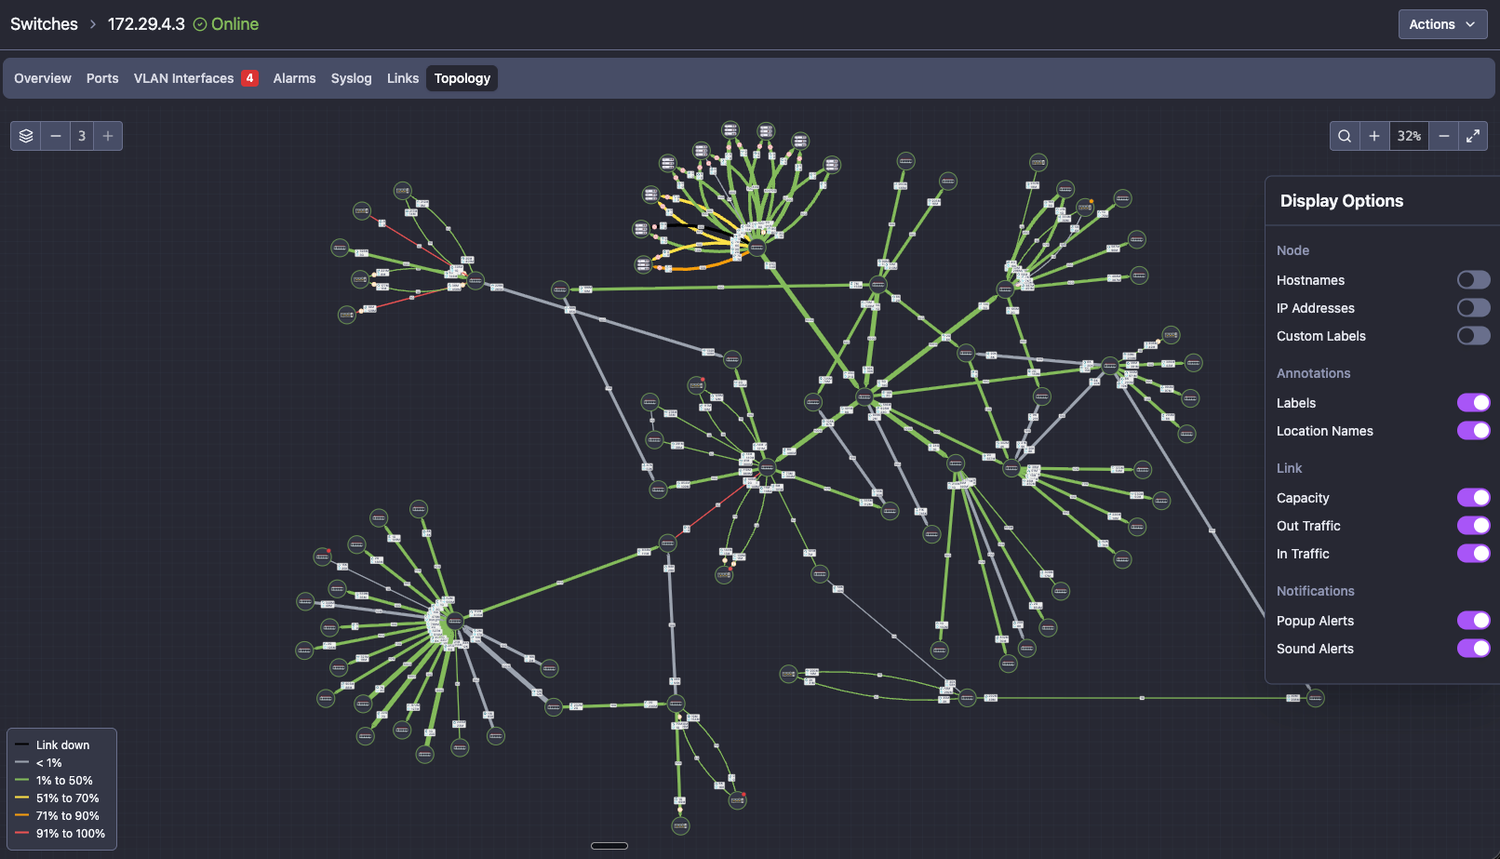
Main features:
- Dynamically connect devices by using the NetSense knowledge about the links (depends on the manual link creation between devices)
- All features from the manual/static maps are available (capacity utilization, device and link status, live traffic, sidebar controls, etc.)
- Highlight a link - by left-click on it - it will highlight the link and the connected devices
- Highlight a device and its links - left-click on any device with highlight it and all associated links
- Highlight the source device - the device that the topology has built from
- Re-arrange devices position - especially useful in large topologies where you want to see the big picture with more clarity (note that the device positions won’t persist on the map and after switching tabs - the topology will be re-generated)
Enhancements
- Manual/static MAP - the following improvements have been developed for the manual/static maps
- Highlight a link or device and its links - the same new features we introduce in the dynamic topology maps are ported to the manual maps as well
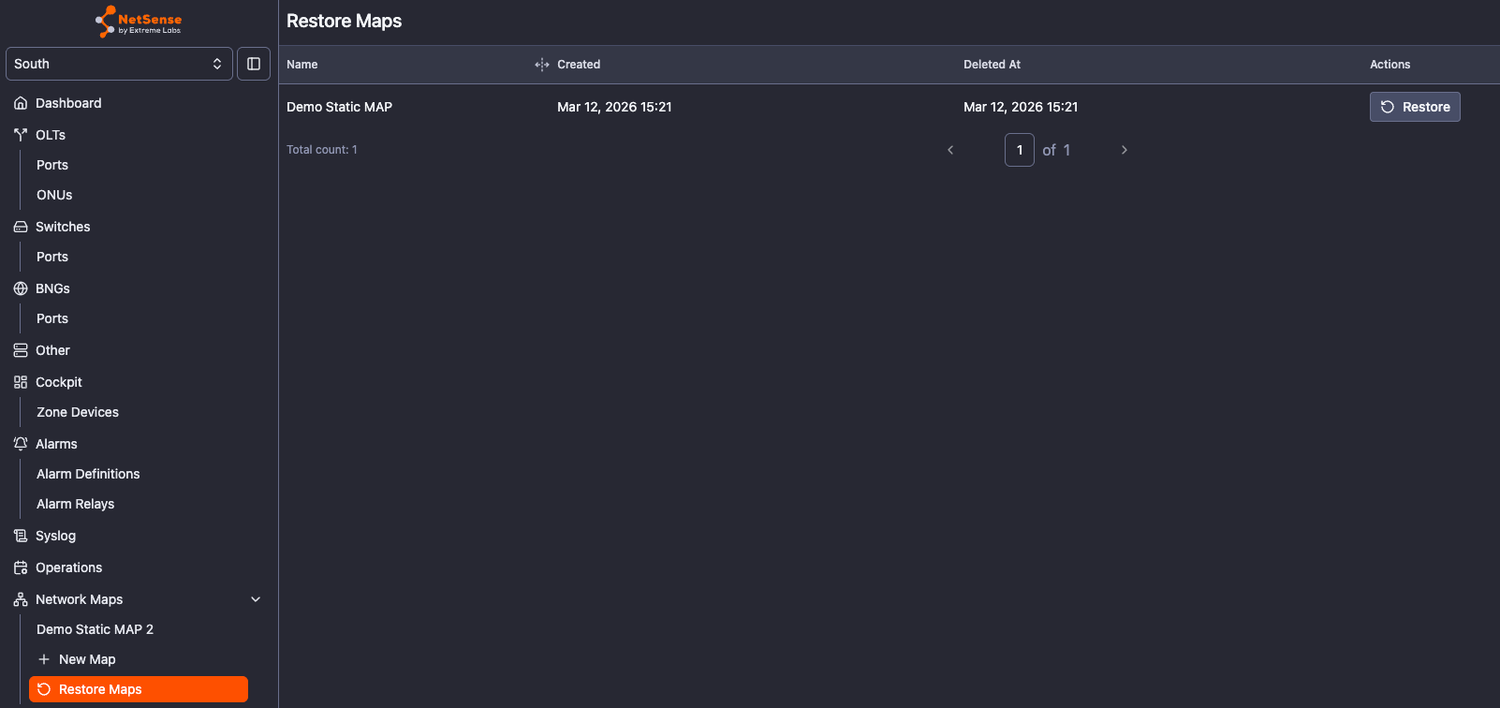
- Restore a deleted map - it is hard to accidentally delete a manual map, but if it happens, the option to restore a deleted map is available.
All deleted maps will persist its last version if needed to be restored.
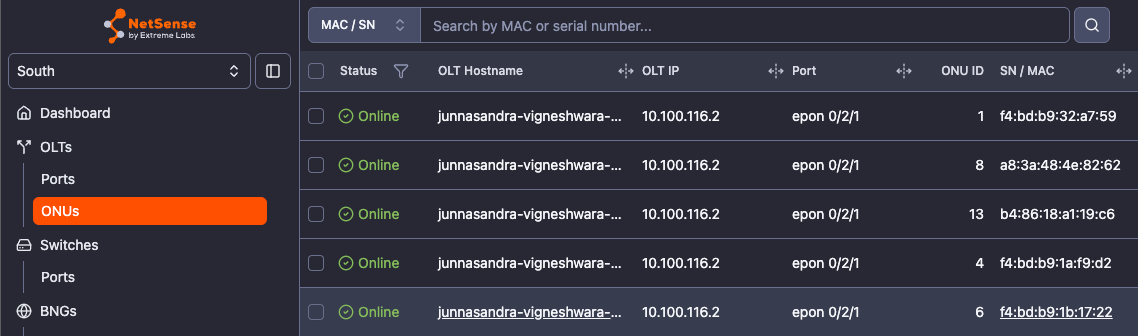
- OLT IP has been included in the common ONU table
Integrations
- Huawei NetEngine 8000 M1A router
- Huawei NE05-SQ router
March 11, 2026
Features
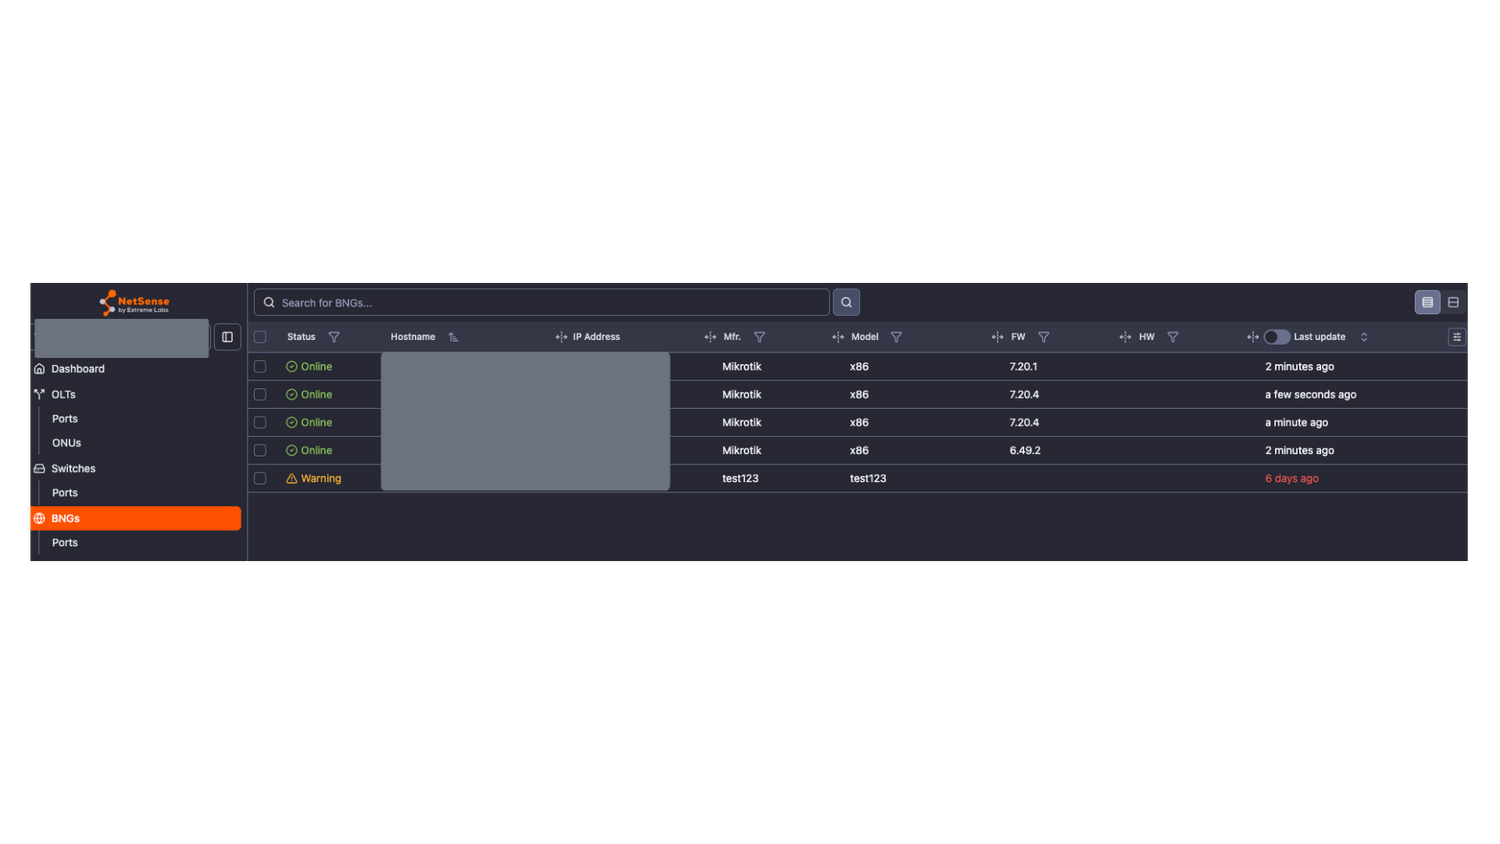
- NetSense now supports new device type - BNG (BRAS) - if a device has been added as BNG it will appear in its dedicated side menu - BNGs with separate polling and specific BNG integration to fetch user-related data as well as device performance data.
Alarms for the BNG system parameters and port parameters are also available.
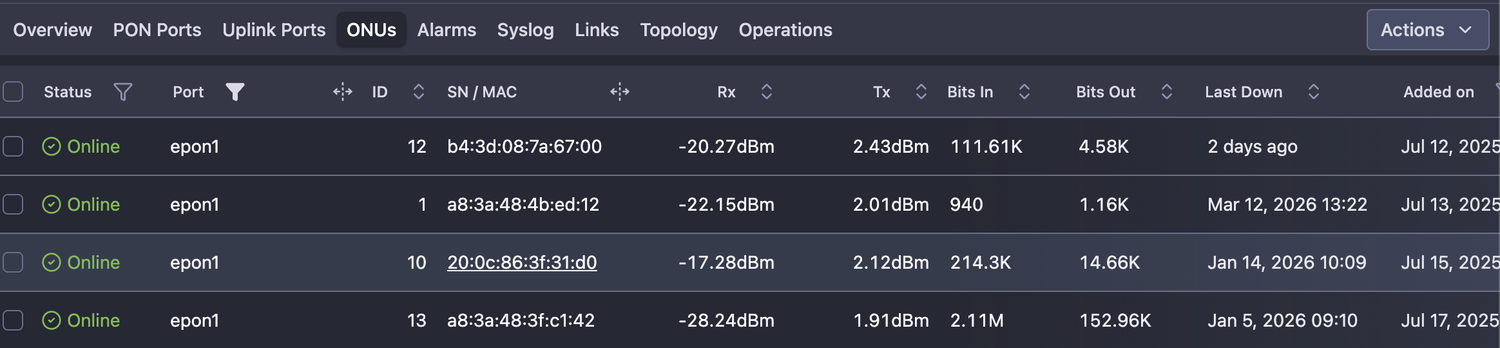
- ONT “Last down” timestamp added as a column in the ONT tables - the data and the visual down reason (different icons for each down reason) can give immediate understanding when and why an ONT is down
- Port actions on Mobile app
- Fetch live traffic
- Fetch Rx/Tx on optical ports
- Links and circuits are now synchronized from Netbox to NetSense (one-way) - they can be used in Manual/Static and Dynamic MAPs
Enhancements
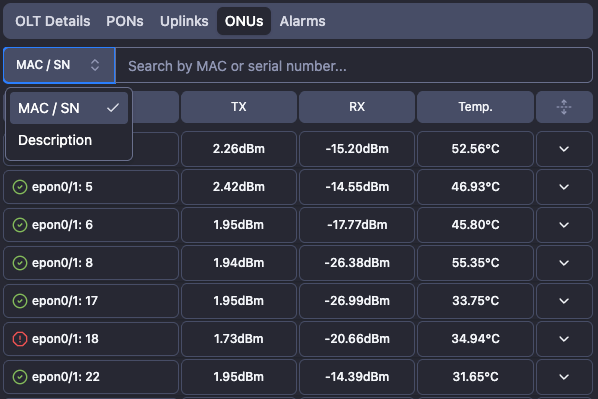
- Improved ONT search interface - now you can search and filter ONTs by MAC address, serial number, OLT hostname or IP or ONT description
- Port actions button has been added to the port details screen
- Network MAP
- Replaced text "O"/"I" labels with ArrowBigUp/ArrowBigDown icons
- Zero-traffic threshold: only links with exactly 0 traffic show as "no traffic" - any traffic above 0 now falls into the next threshold range
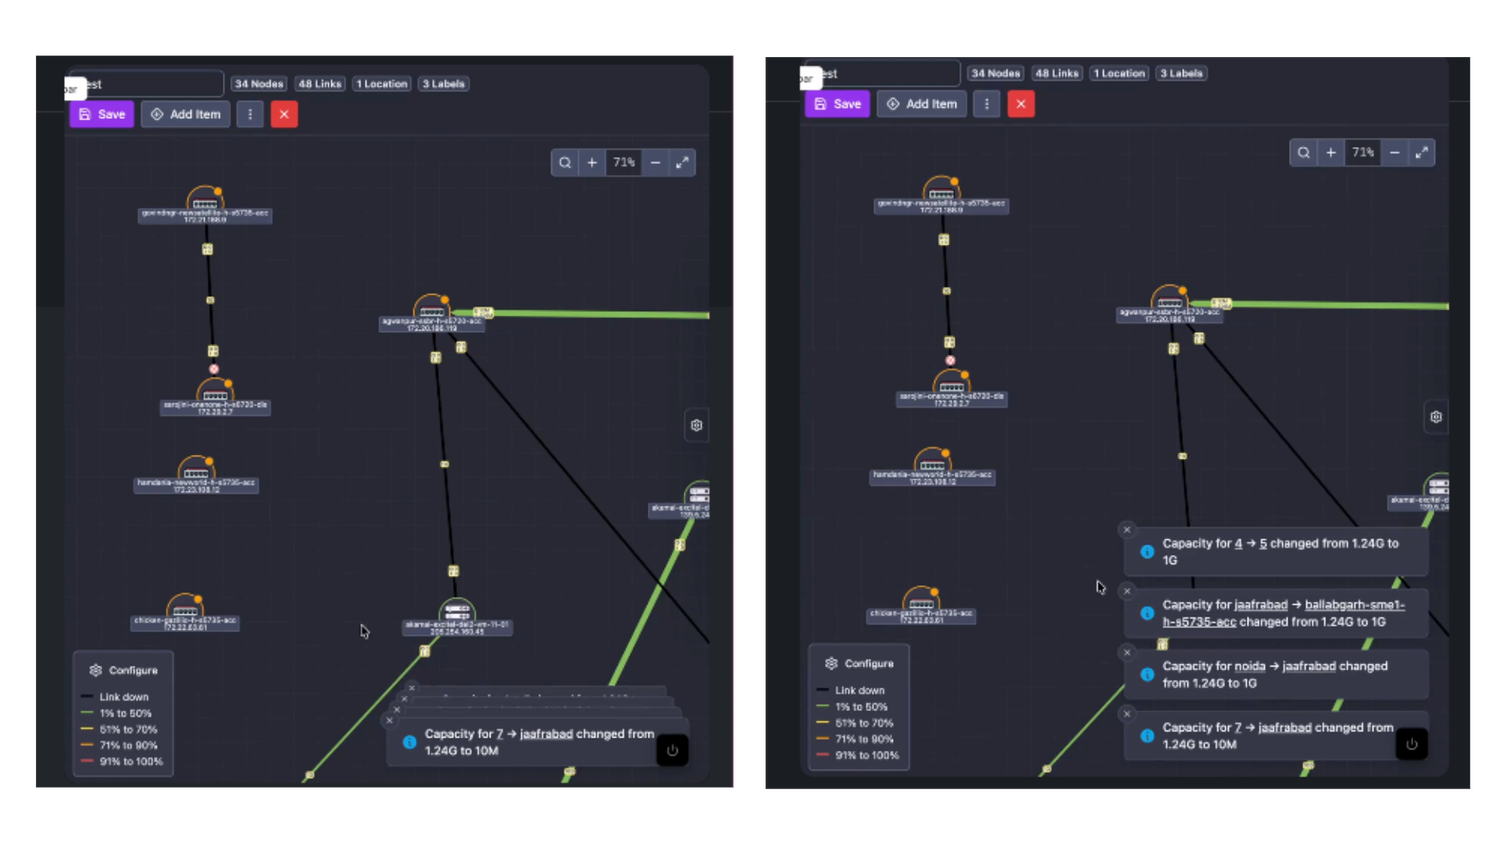
- Added [HH:MM:SS] timestamp to device status change and capacity change messages
- Improved Network MAP visibility on the device hostnames and traffic balloons
Bugfixes
- Fixed: QoE calculation discrepancy
- Fixed: Model filter in inventory view
- Fixed: Ufispace switches stop reporting traffic after an enormous spike
- Fixed: Rules that used =! were applied to the first option only
February 20, 2026
Features
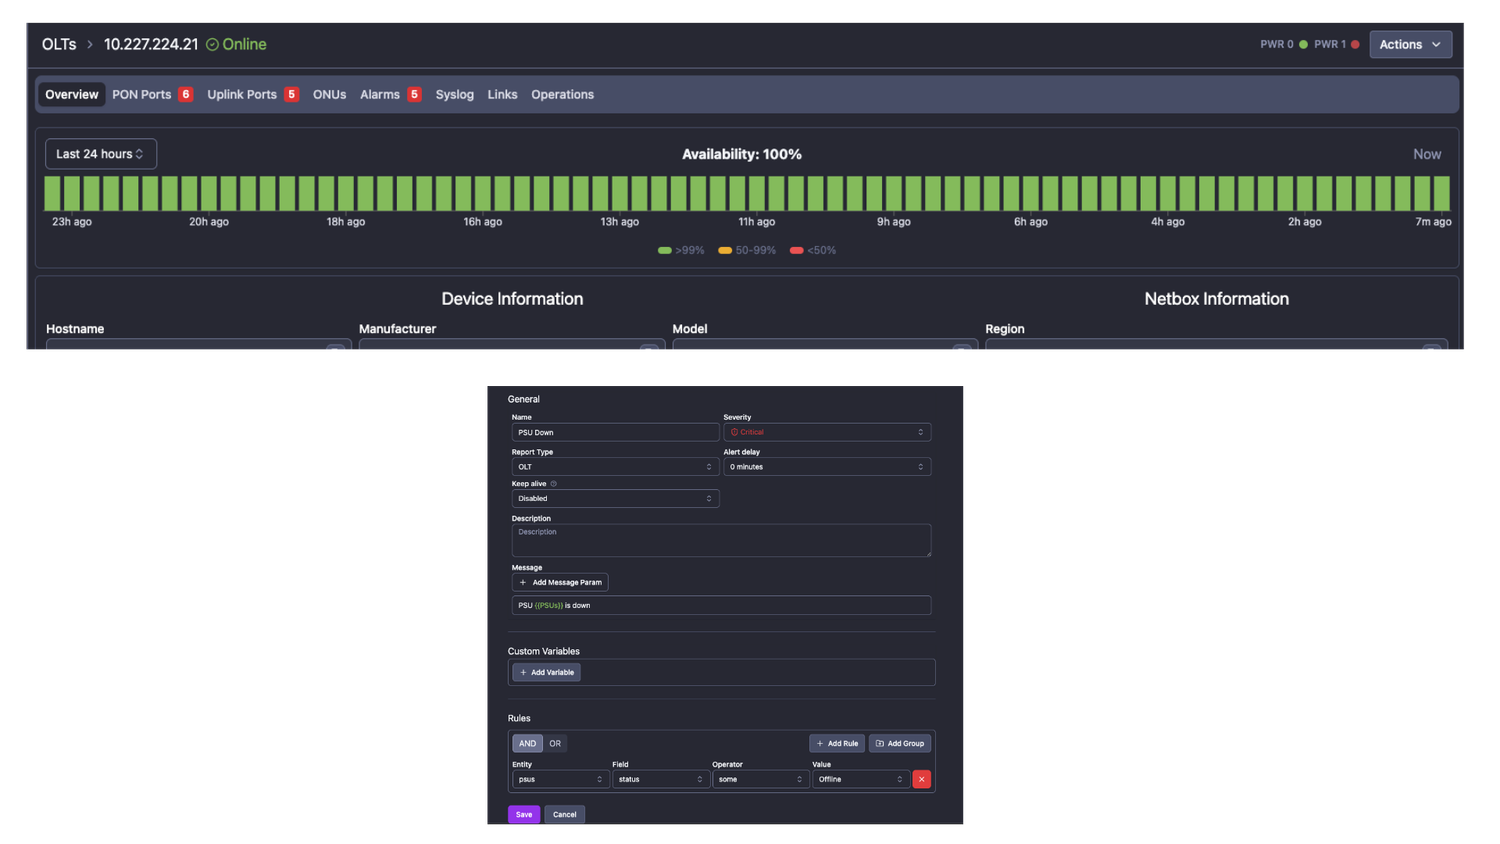
- Power Supply (PSU) status monitoring and alerting on supported OLT models
PSU status for models with two or more units is visualized in the upper right corner of the OLT details - next to the Actions button
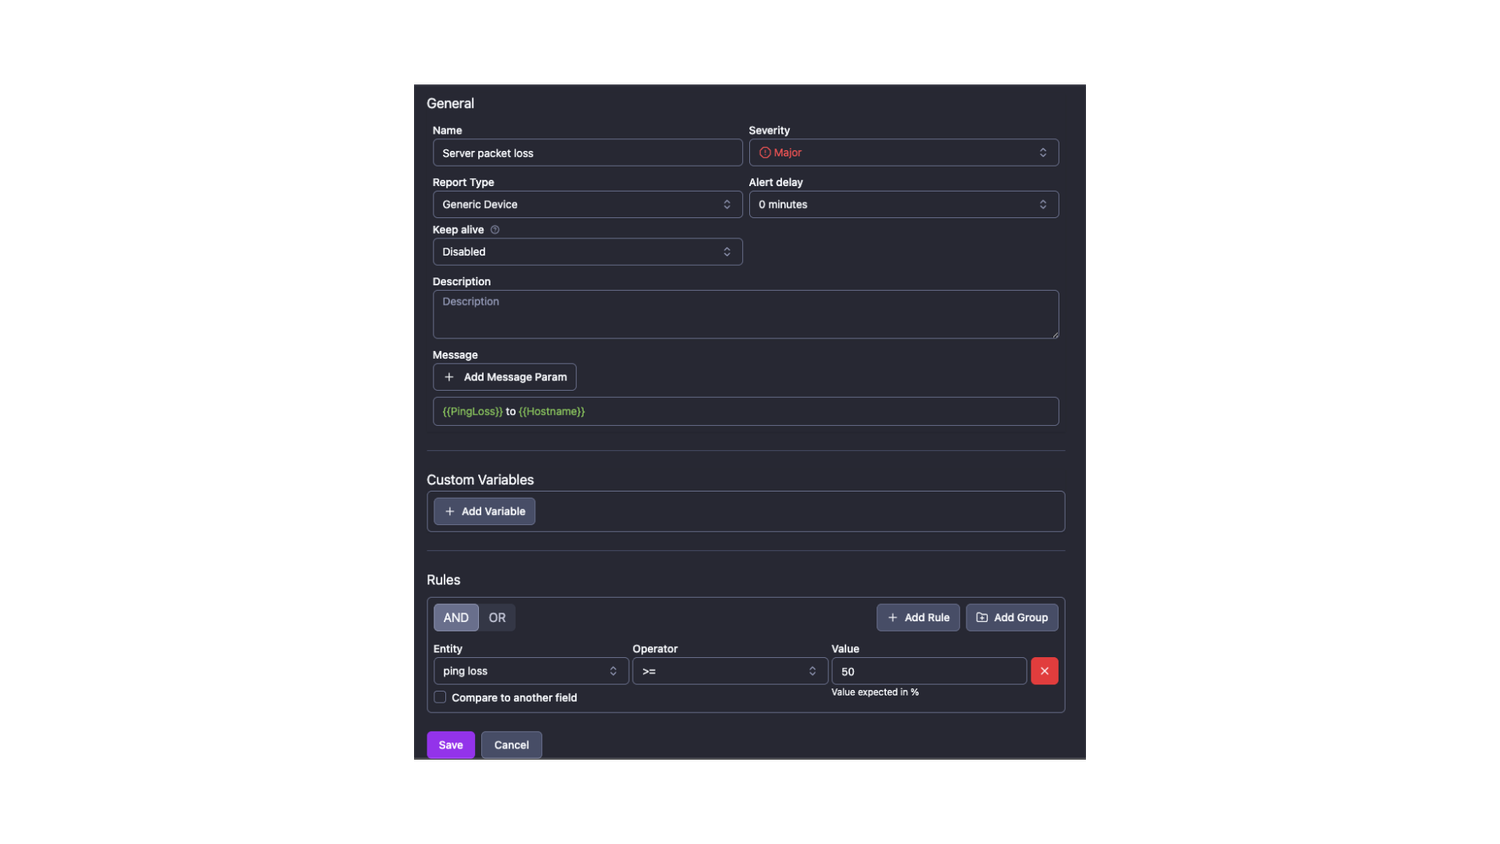
- Alarms for servers and other “Generic devices”
Servers and other generic devices which are not switch/router or OLT are located in “Others” tab of NetSense. Currently, status, packet loss and latency can be configured as alert parameters for those devices.
Enhancements
- Network MAP feature was updated with the following features:
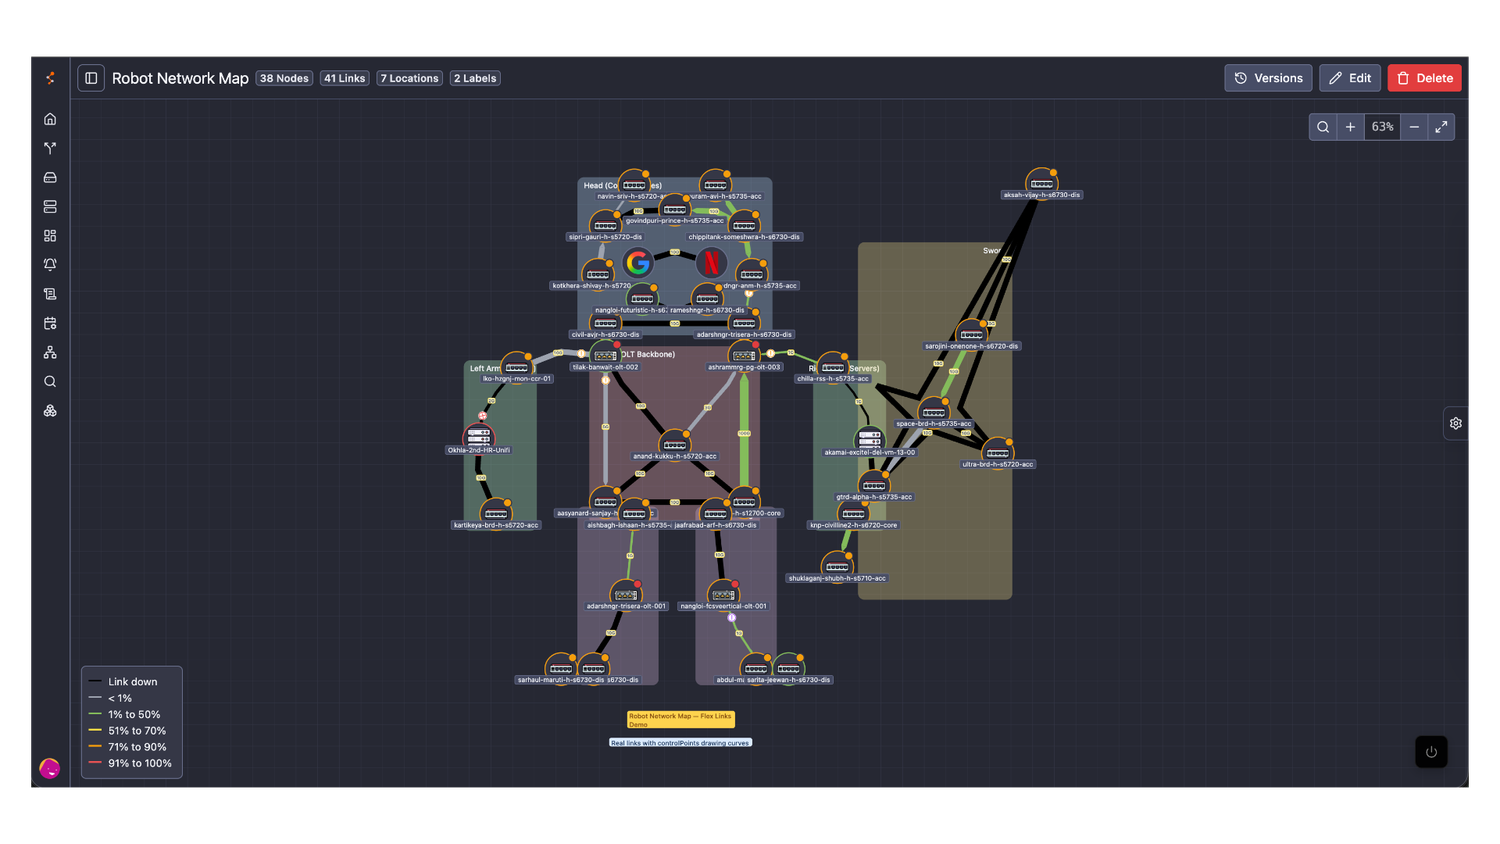
- Flexible links
Now you can draw links in whatever shape you need - not as a straight line only. This way the manual maps could become a lot more beautiful and easy to comprehend.
- Flexible links
- Animated links/nodes status or parameters change
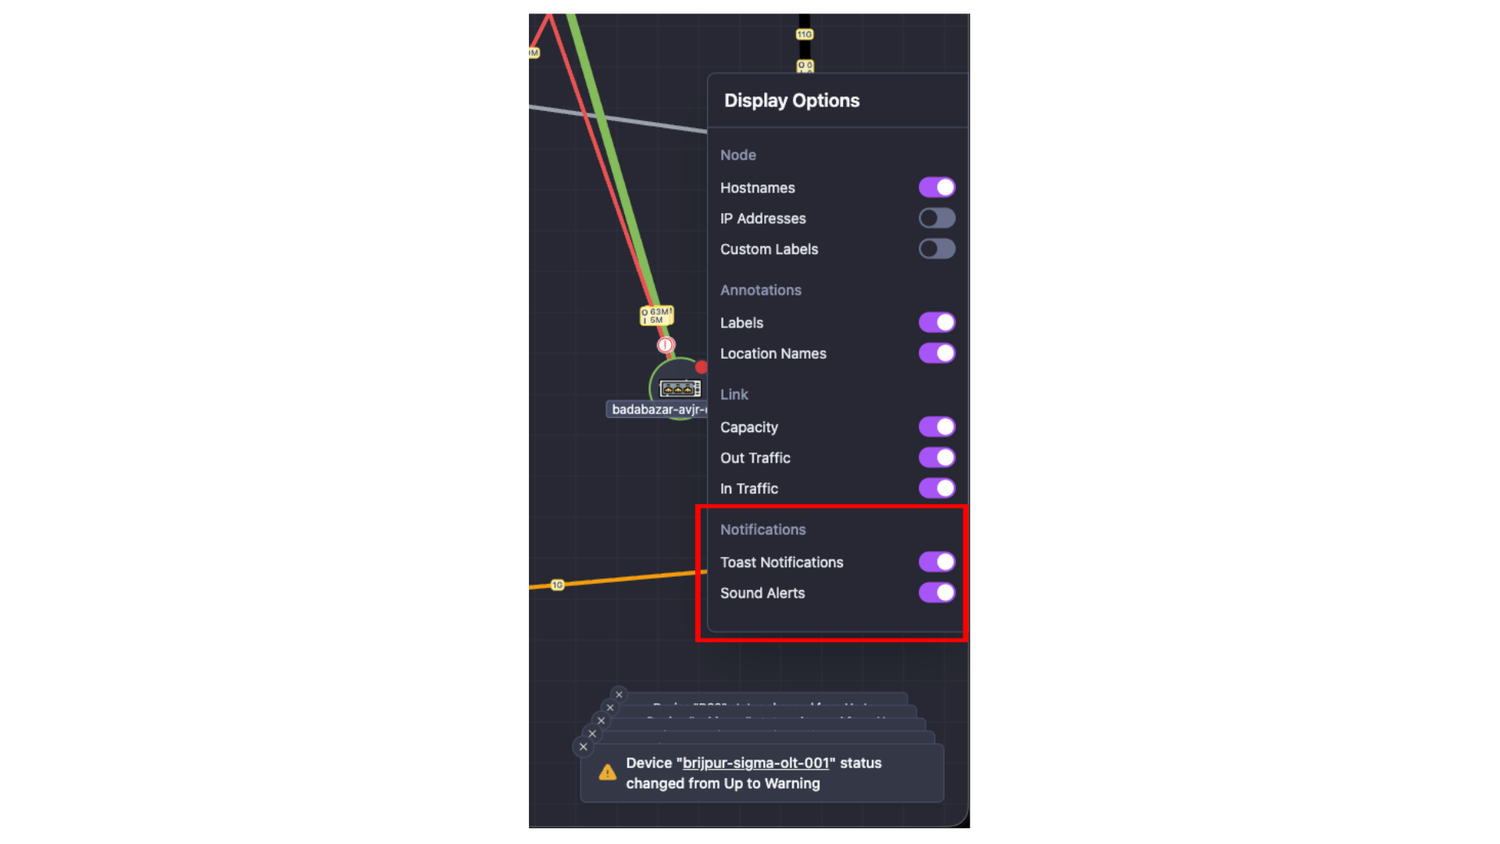
When a node or changes its status (or link capacity), it will be blinking 3 times, attracting the user’s attention to the updated object - Notification messages and sound alerts on object change
All object status changes are logged and displayed in a stacked messages in the bottom right corner
- Additional options for notifications and sound alarms management in the side control panel
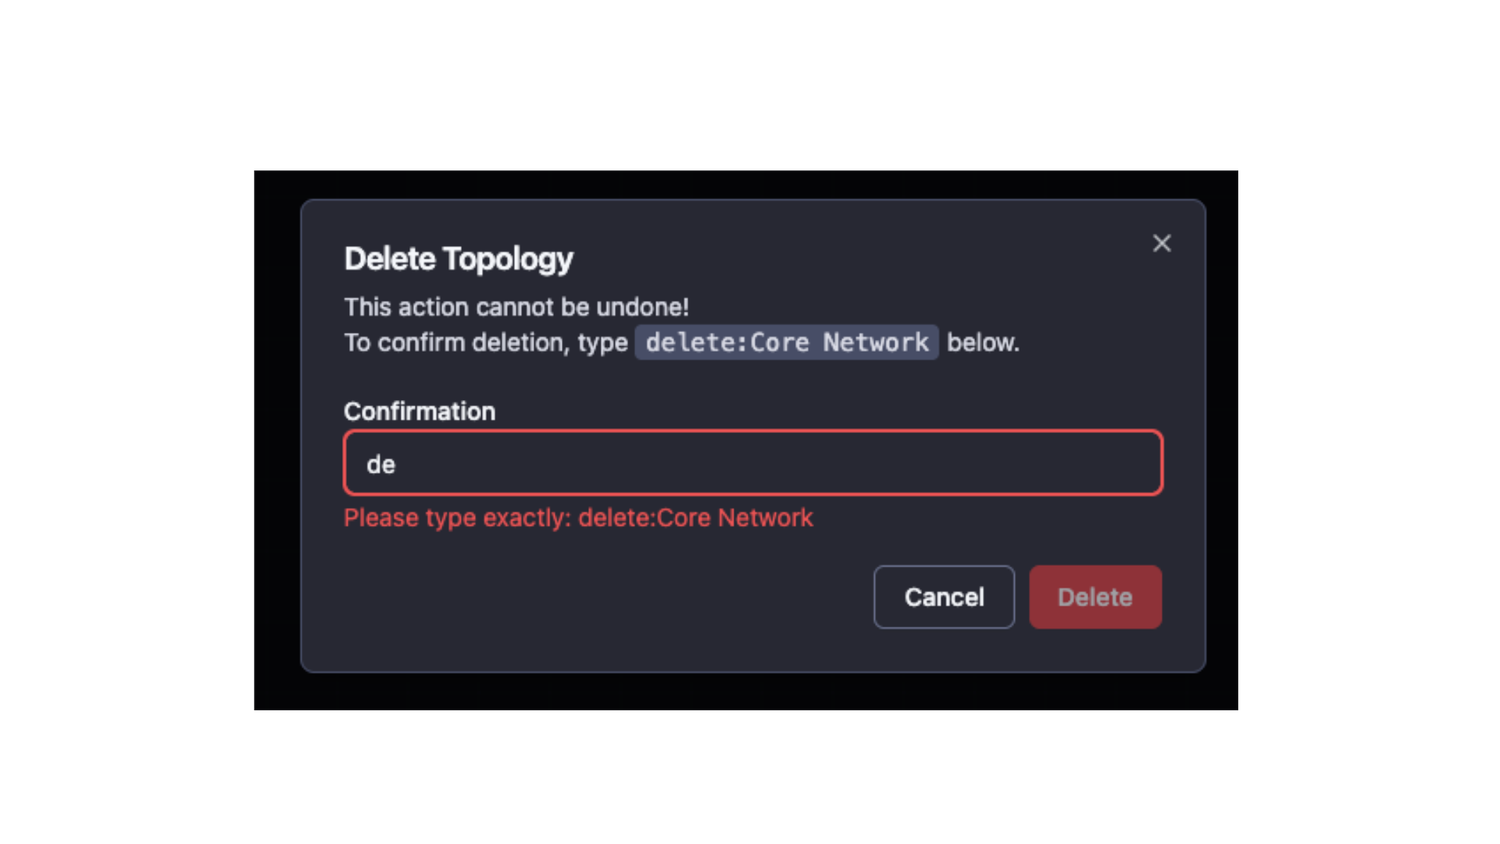
- New flow to permanently delete maps
Additional step requires to type delete:<map_name> to confirm delete operation
- Added actions on link right click
- Open Point A or Point Z port details (shows all port charts)
- Live traffic on the Point A port
- Live traffic in new tab on the Point A port
- Other visual enhancements
- When a device is down - all links connected to it will color with the default color for down link - very easy to show the impact
- ⬆️ and ⬇️ traffic indicators in the capacity balloons are changed to I and O (In/Out)
- Improved tooltip on link hover - it is bigger and shows Point A/Z Device → Port → Description
- Added option to delete ONUs with “Unknown” status
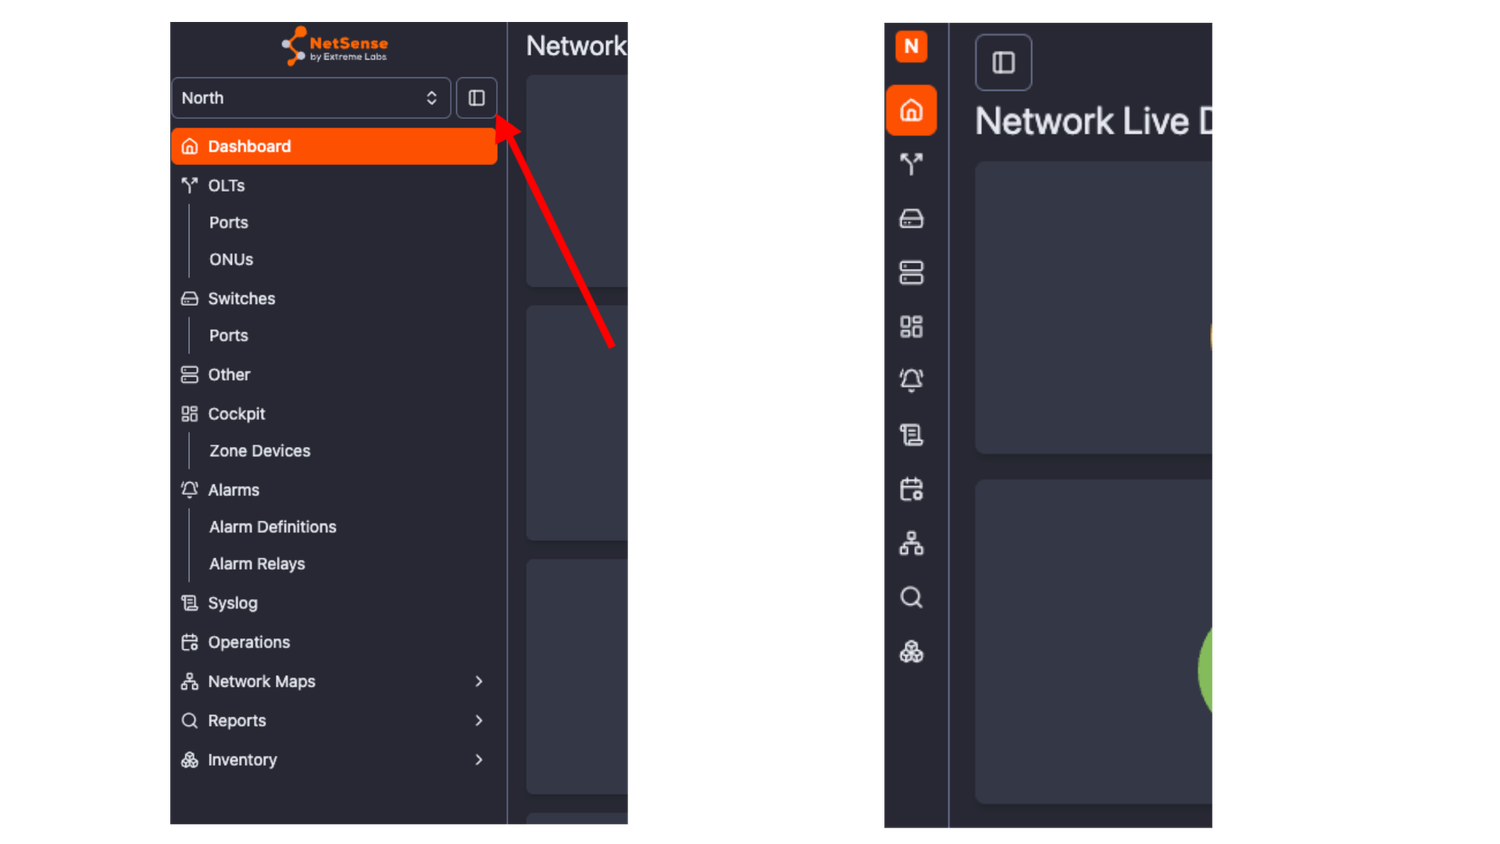
They will be auto-deleted in 7 days but now you have the option to delete them on the spot - Redesigned NetSense sidebar menu
The sidebar menu is with adjustable size and has icons in collapsed mode
Integrations
February 13, 2026
HotFix
- Fixed: Proper handling of Rx power reported as 0 mW in Huawei S6720
- Fixed: Properly fetch and visualize ONT-related params (Rx, Tx. Temp) on DBC GPOLT-3602-2TE-B OLT model
Enhancements
- CPU/Memory utilization and Temp on Huawei OLT models are now being fetched and visualized
February 4, 2026
Features
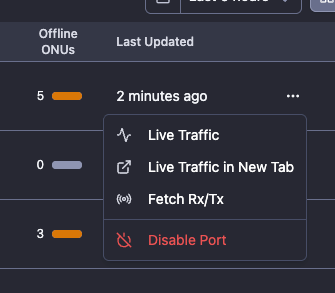
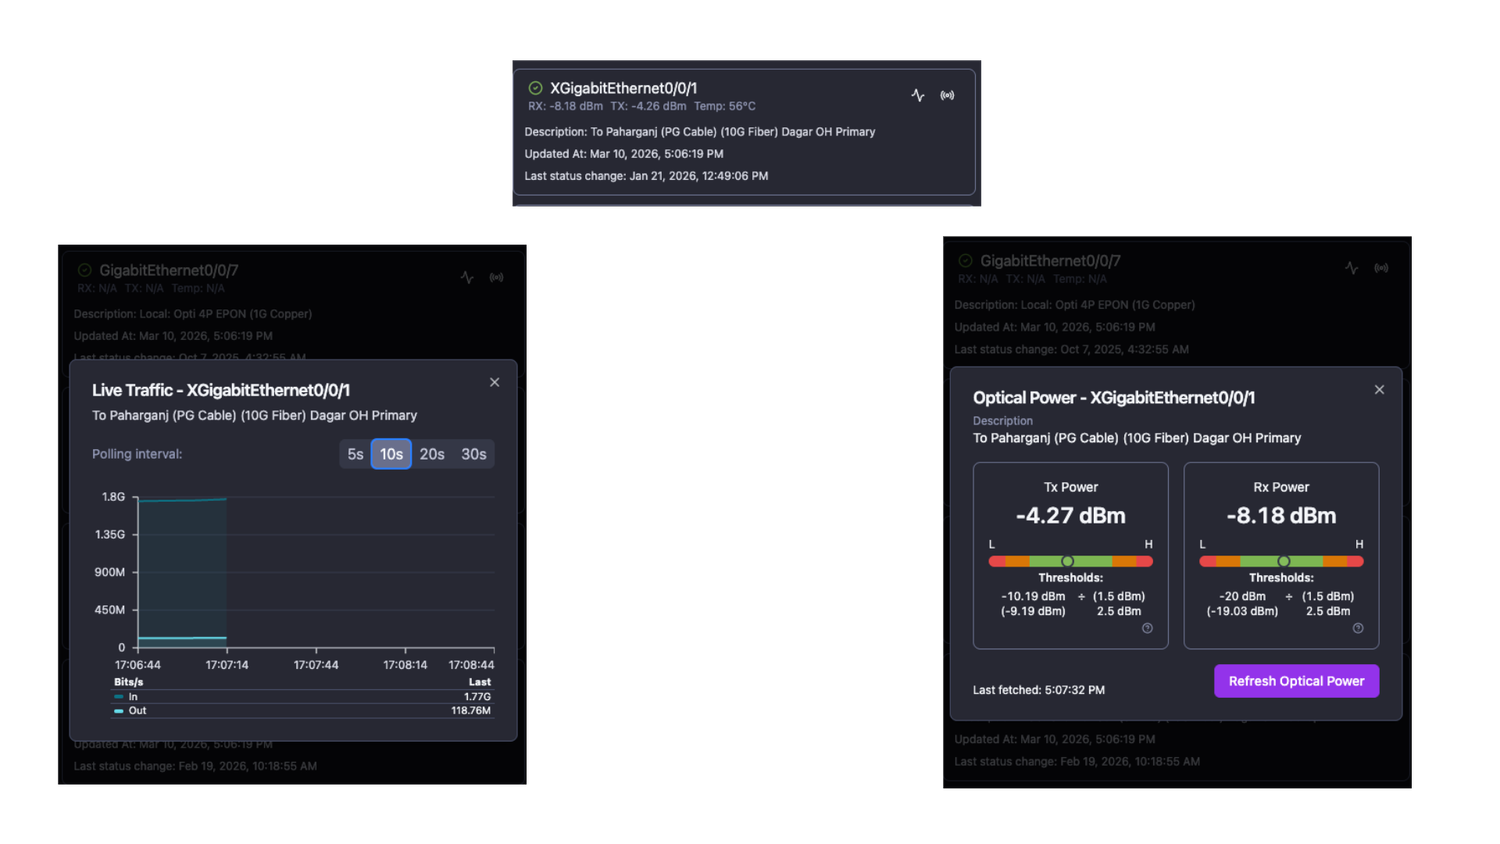
- Port Actions - a new actions menu give access to the following actions on the ports:
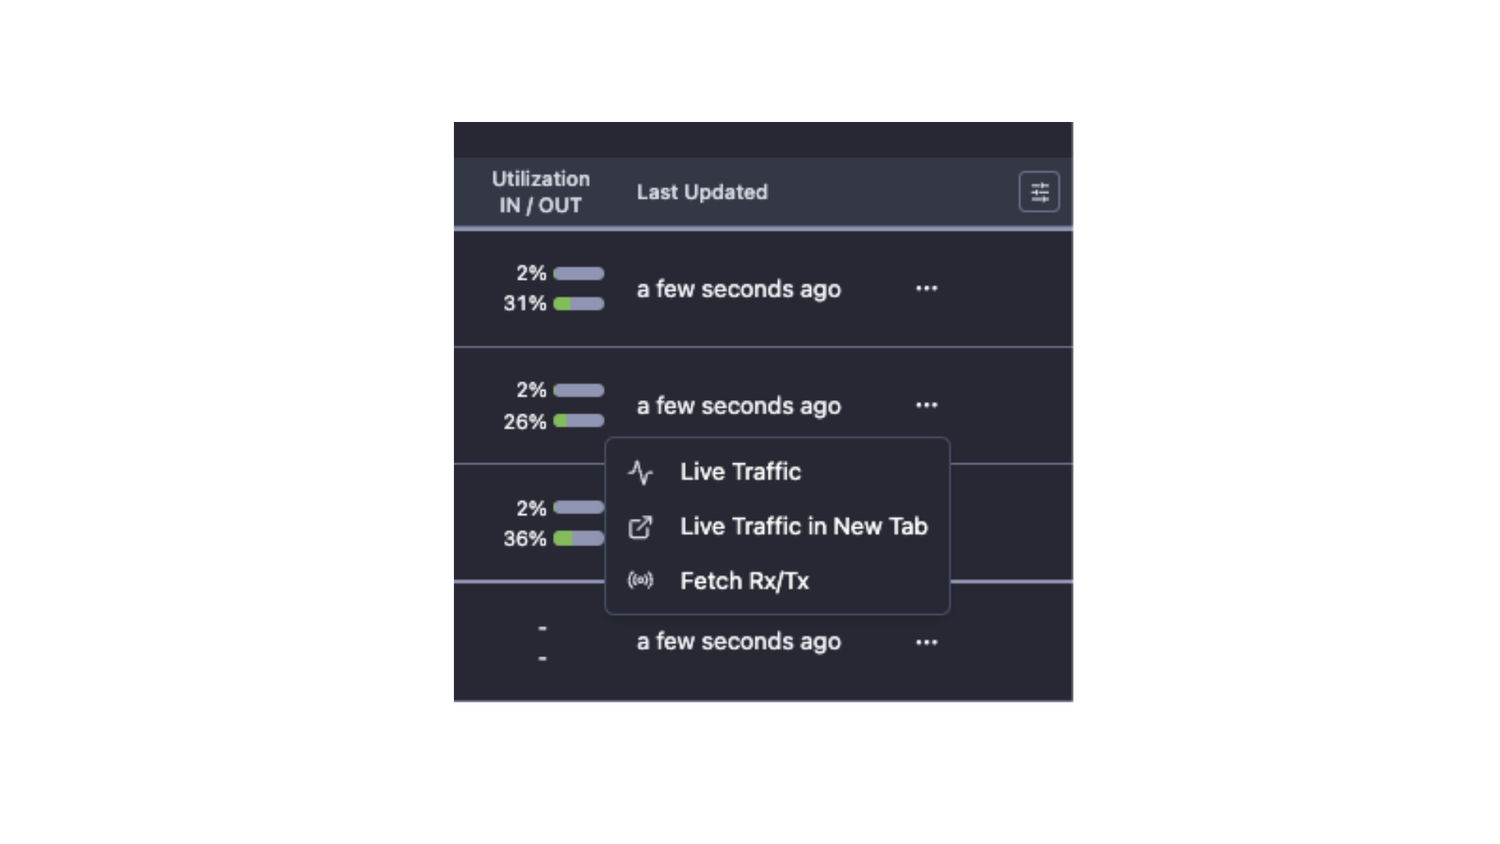
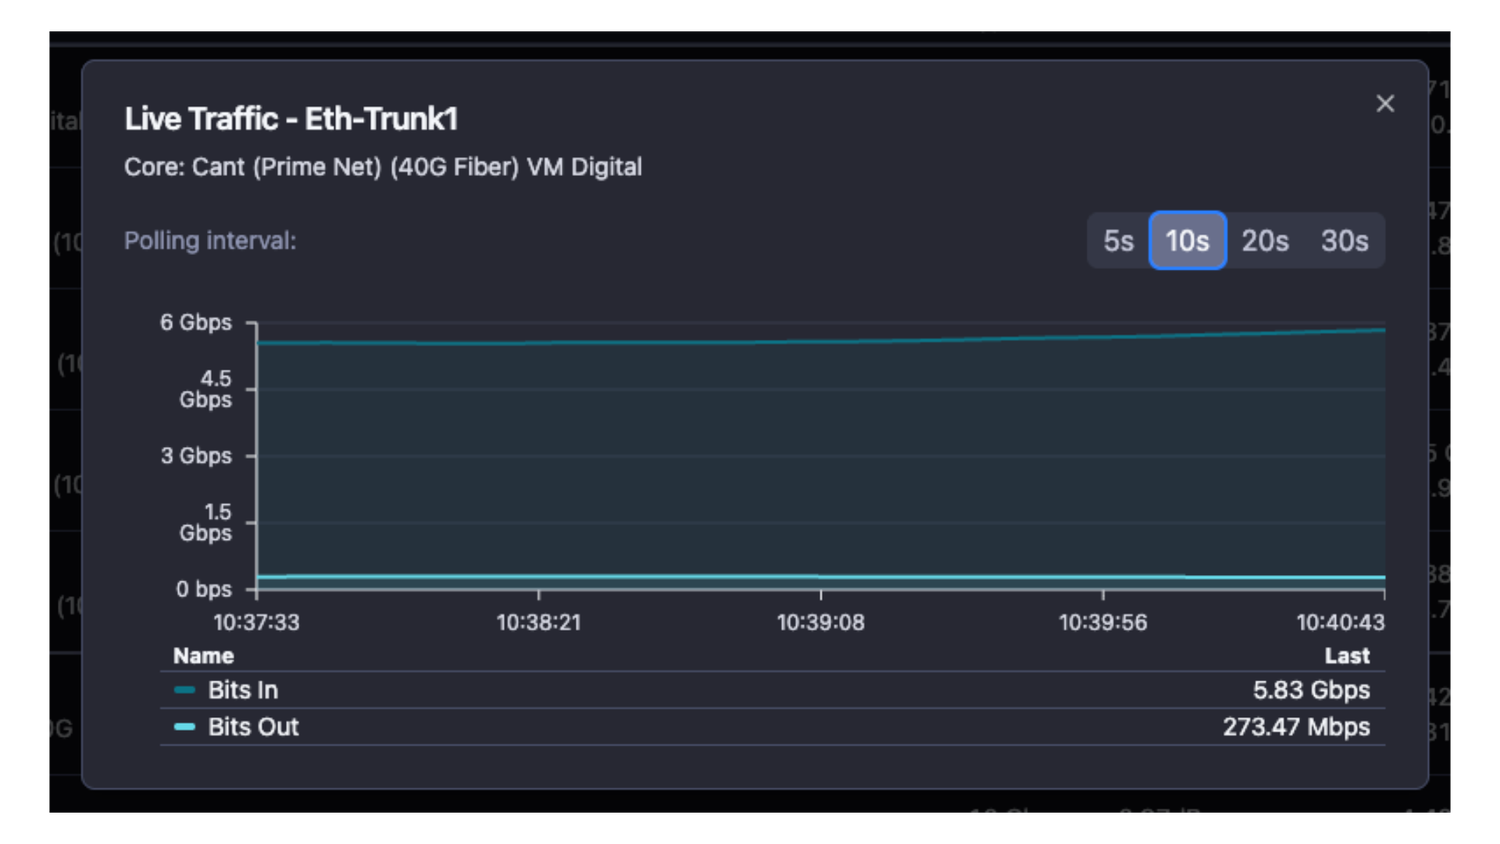
- Port Live traffic - network engineers often need to see live traffic on the interface in real time. Whether if they do traffic migration or investigate other issue, interface live traffic monitoring is critical for the success of the task.
Port live traffic comes in two flavors: you can open it right away or you can open it in separate tab (when you need to monitor multiple interfaces simultaneously)
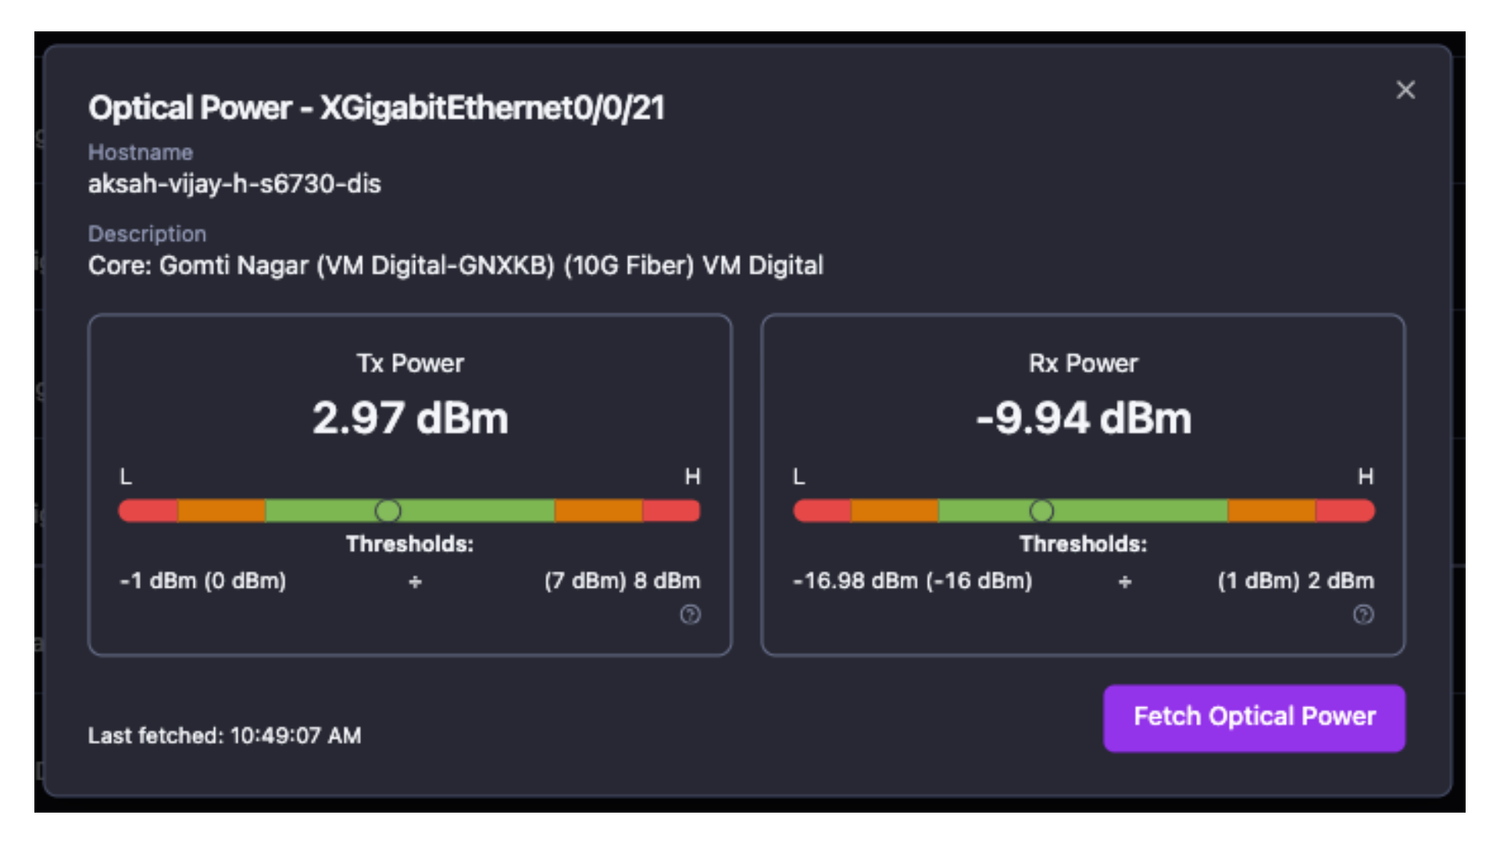
- Fetch Rx/Tx - optical parameters are a critical component for the interface health. When rectifying a network issue, field engineers or remote teams need information in real time. Often waiting for the optical parameters to update with the regular device polling cycle is too slow - this is why we have developed the feature to fetch the interface optical parameters in real time - for field or desk teams.
- Port view - a new, detailed visual representation of all port parameters
- Detailed interface statistics
- Compare parameter between all interfaces
Enhancements
- Alert level values for SFP parameters are also captured and added as alarm parameters
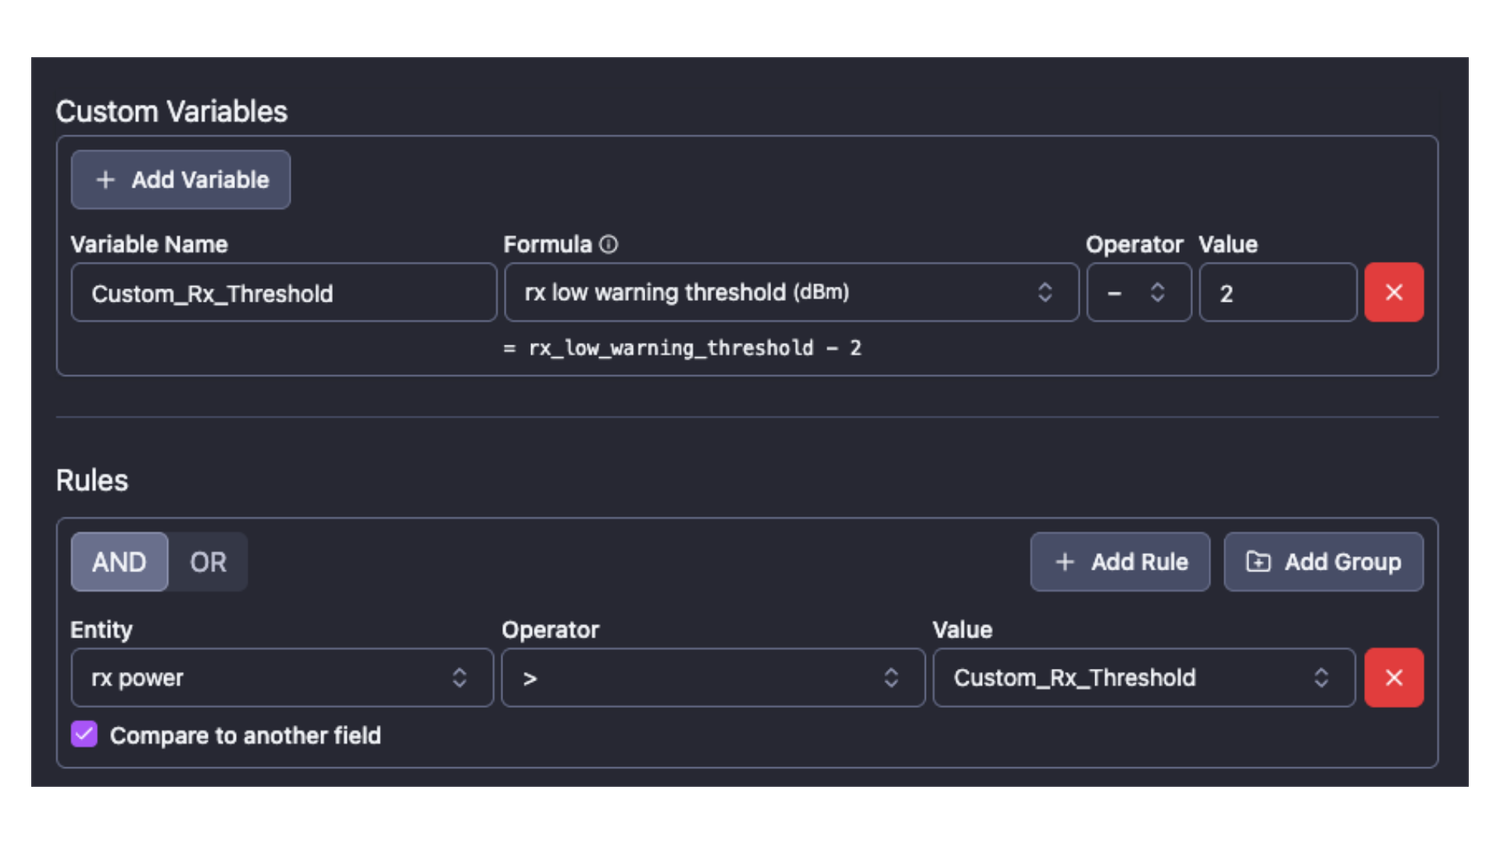
- Compare values from the same field type in alarms:
Example: you can now compare the current Rx power on an interface with one of its thresholds (Low/Hi Warn/Alert) and this way create alerts based on dynamic values, instead of using static thresholds - Custom parameters in alarm definitions - you can define your own parameters as thresholds for alarm triggering by using the existing parameters and applying functions on them.
Example: If we extend the example for Rx power to threshold comparison, we could define custom parameter for rxpower_threshold - 2 and have even lower dynamic threshold to compare with
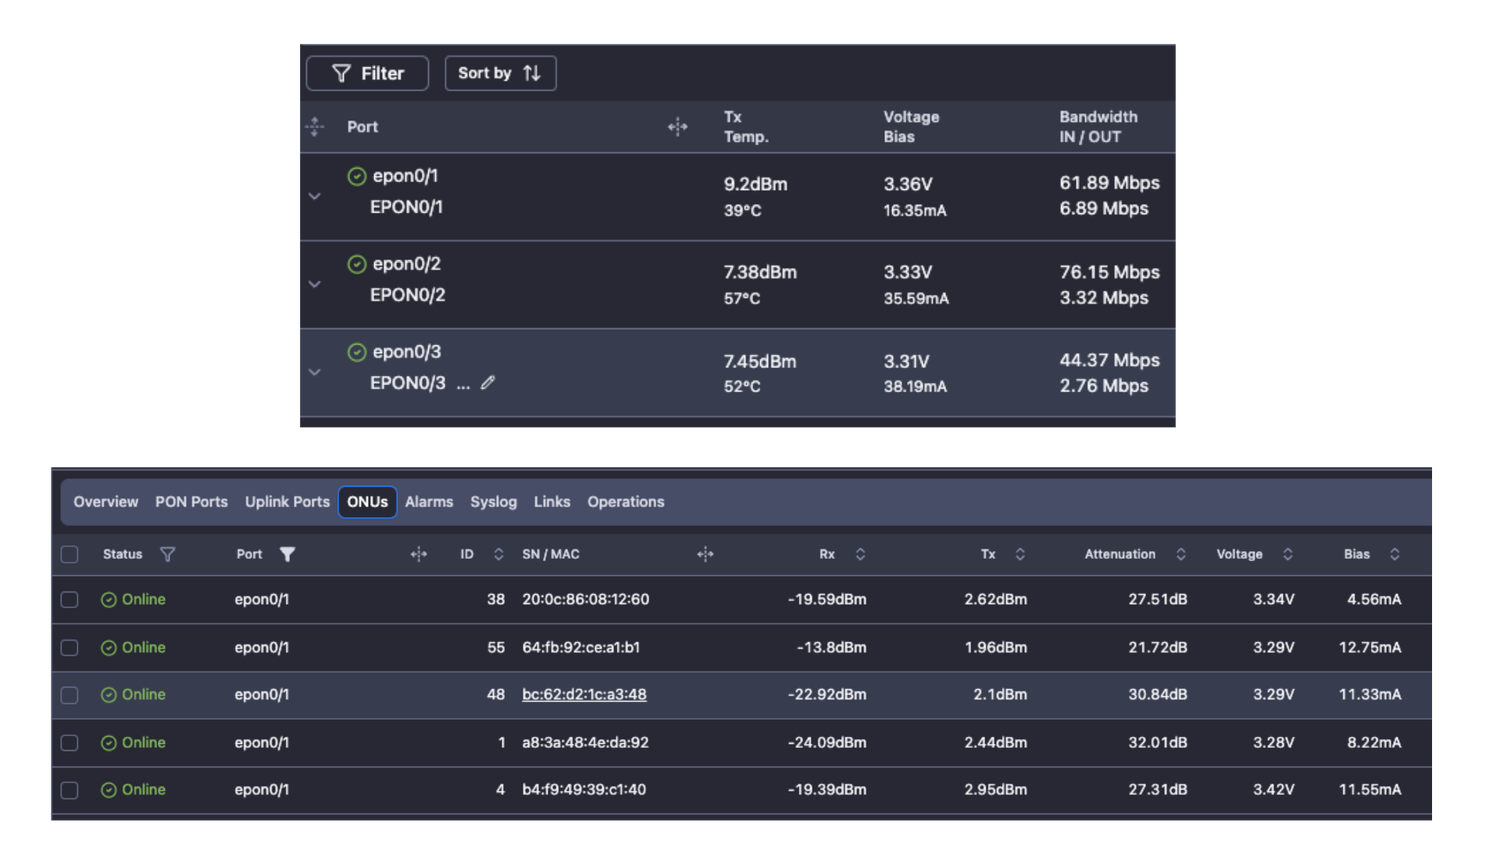
- Added voltage and biasCurrent as a measured parameters for PON ports and ONTs
Bugfixes
- Genexis Mars OLT uptime and syslog discrepancy
- Minor fixes related to Network topology maps
Integrations
- Huawei CE5850-48T4S2Q-EI
January 15, 2026
Features
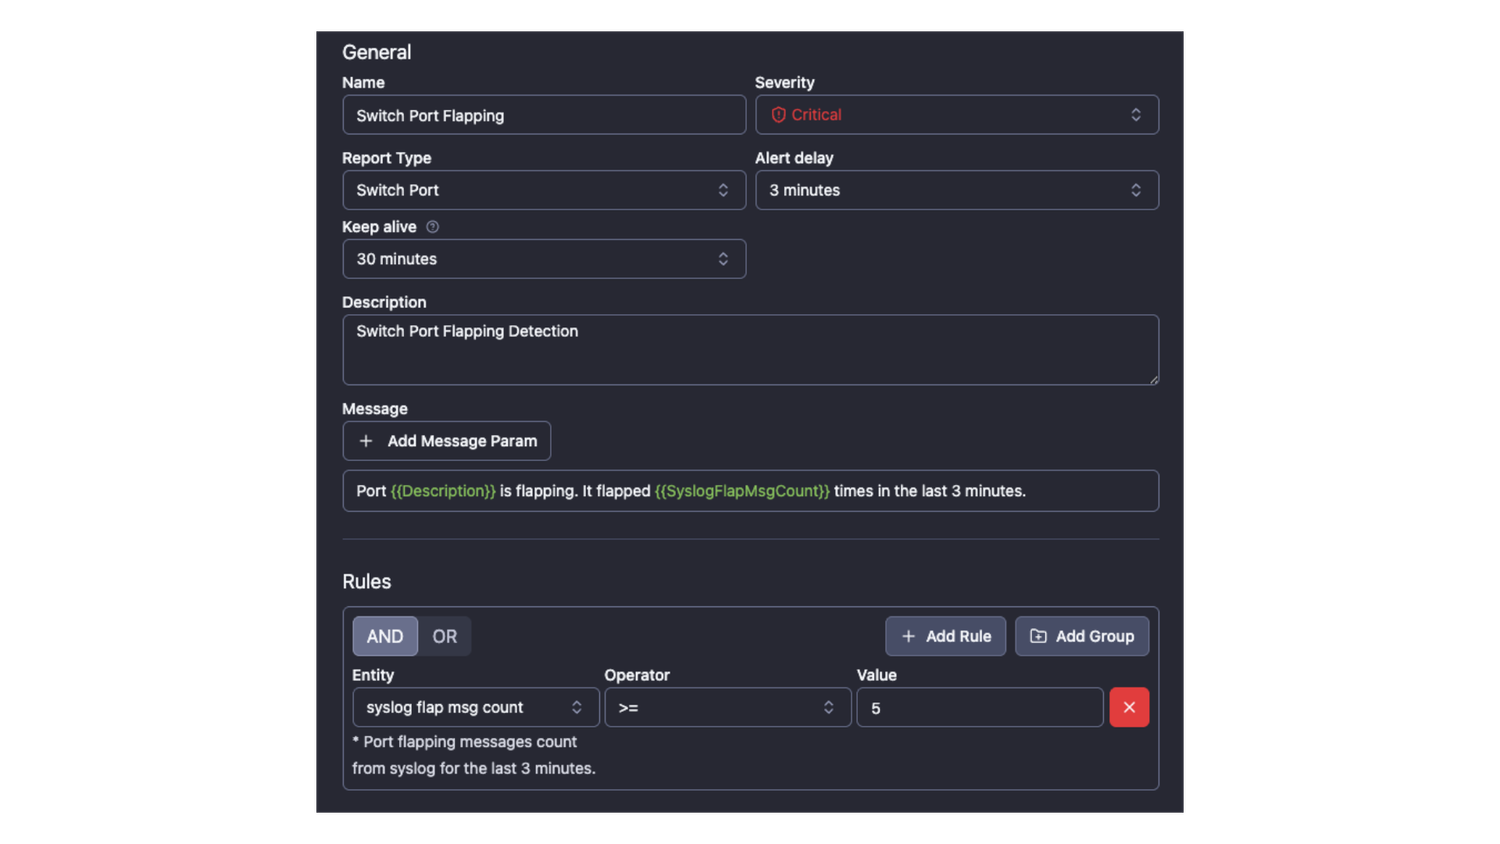
- Flapping Port Detection and Alerting: This feature monitors syslog messages to track Port Up/Down transitions over 1, 3, or 5-minute intervals. It offers flexible alarm configurations, allowing you to trigger alerts based on specific flap counts within your chosen timeframe (minimum 1 minute).
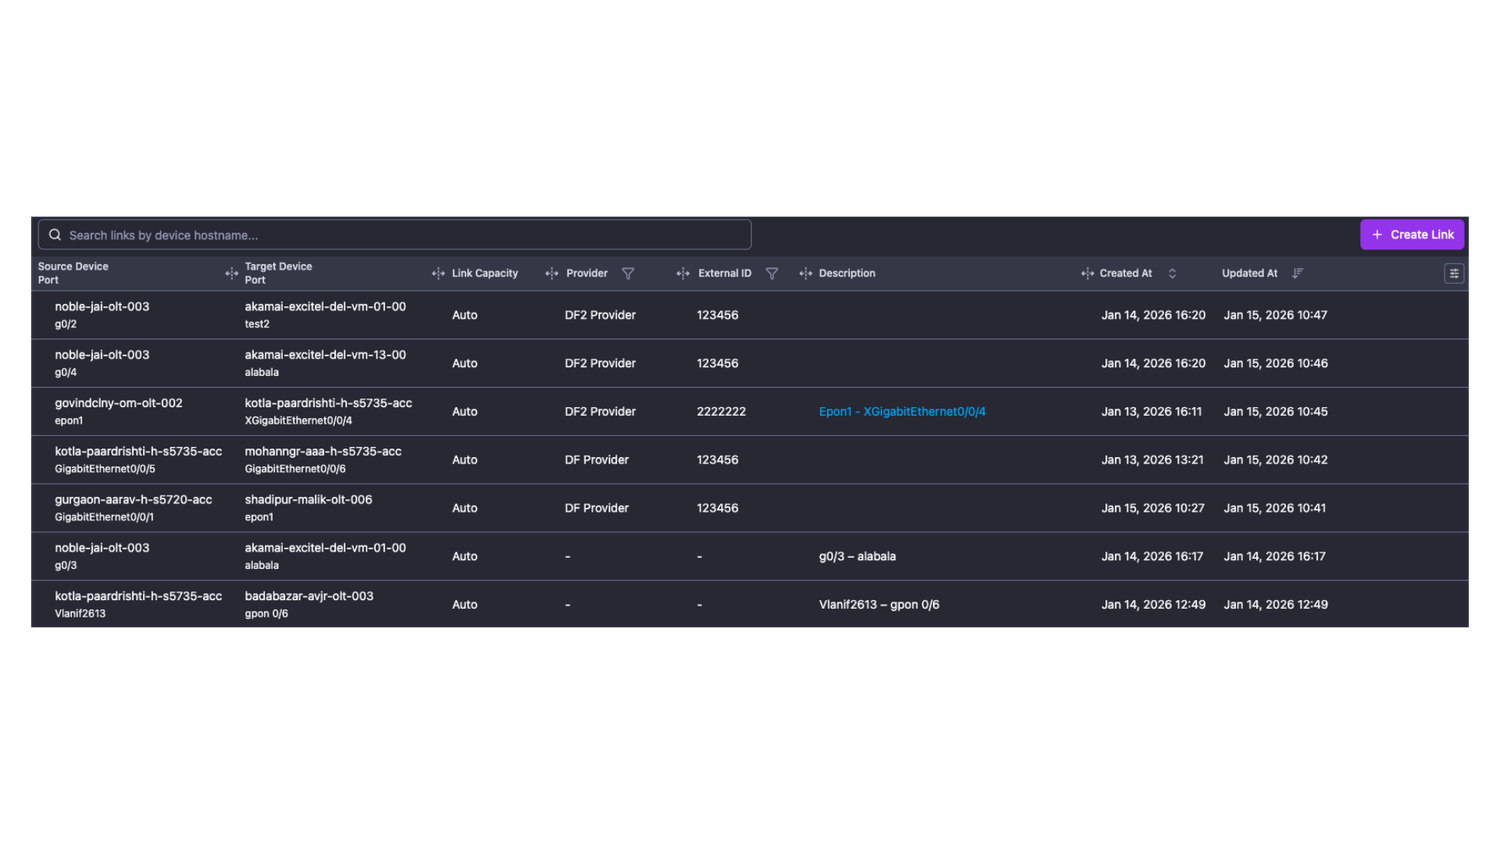
- Device Links: Manage your internal and external links directly within NetSense and replace manual spreadsheets. More importantly, all links created in NetSense are integrated into the Network Maps for seamless topology creation. This data-driven approach paves the way for upcoming automated mapping features based on your link information.
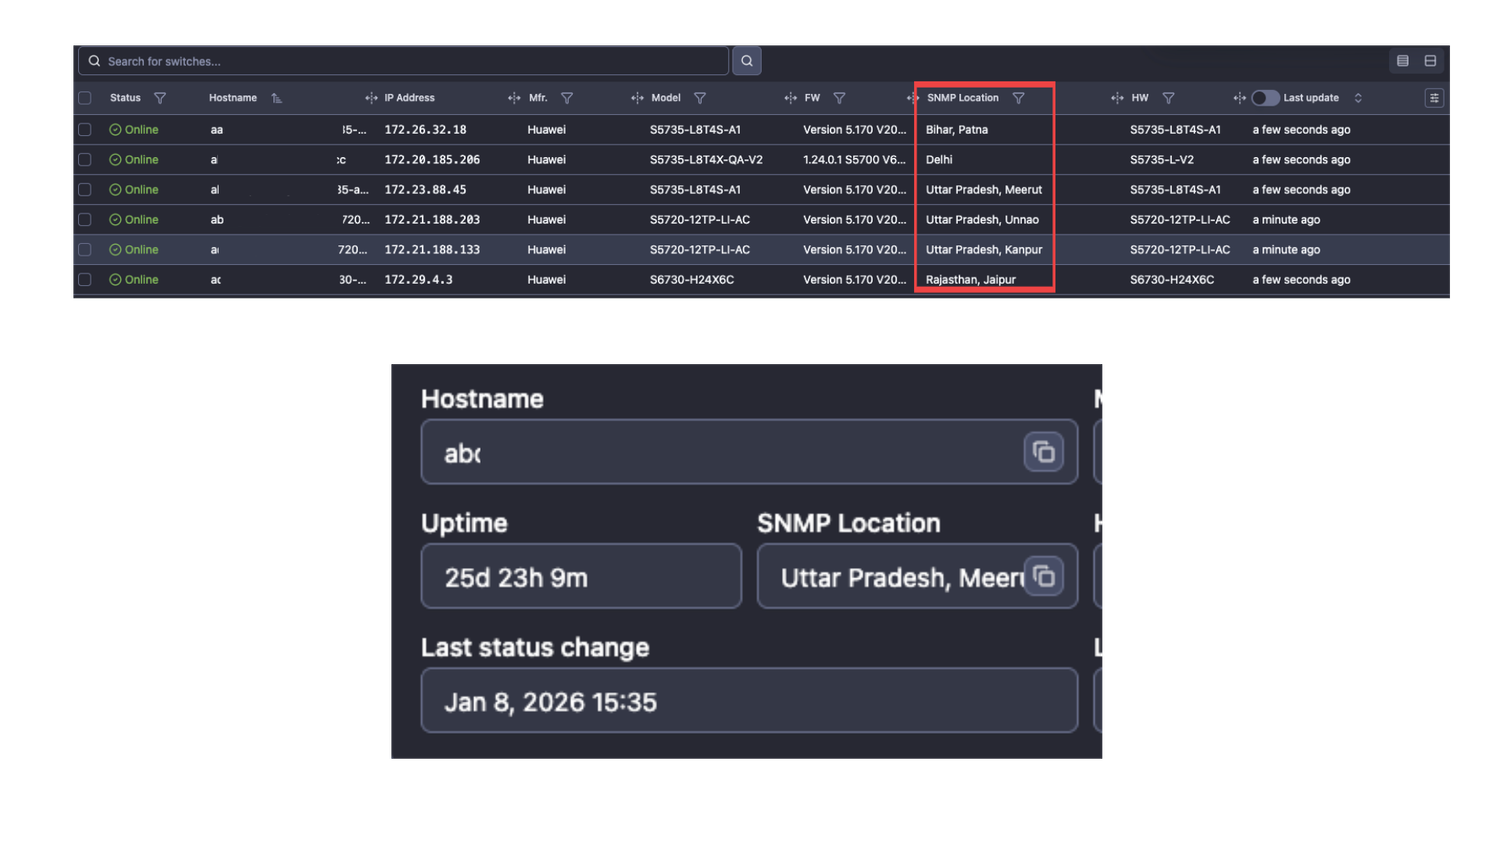
- Device SNMP Location: The sysLocation configured on a device is now retrieved and displayed in both the device details and the device list. Users can also filter the device list based on these sysLocation values.
- Alarms Keep-Alive - is a feature configurable in each alarm definition that prevents an alarm from closing, regardless of its real state. At the end of the configured keep-alive time, NetSense checks if the alert is still active; if it is, the timer expires. If the alert is no longer active, it is closed.
Enhancements
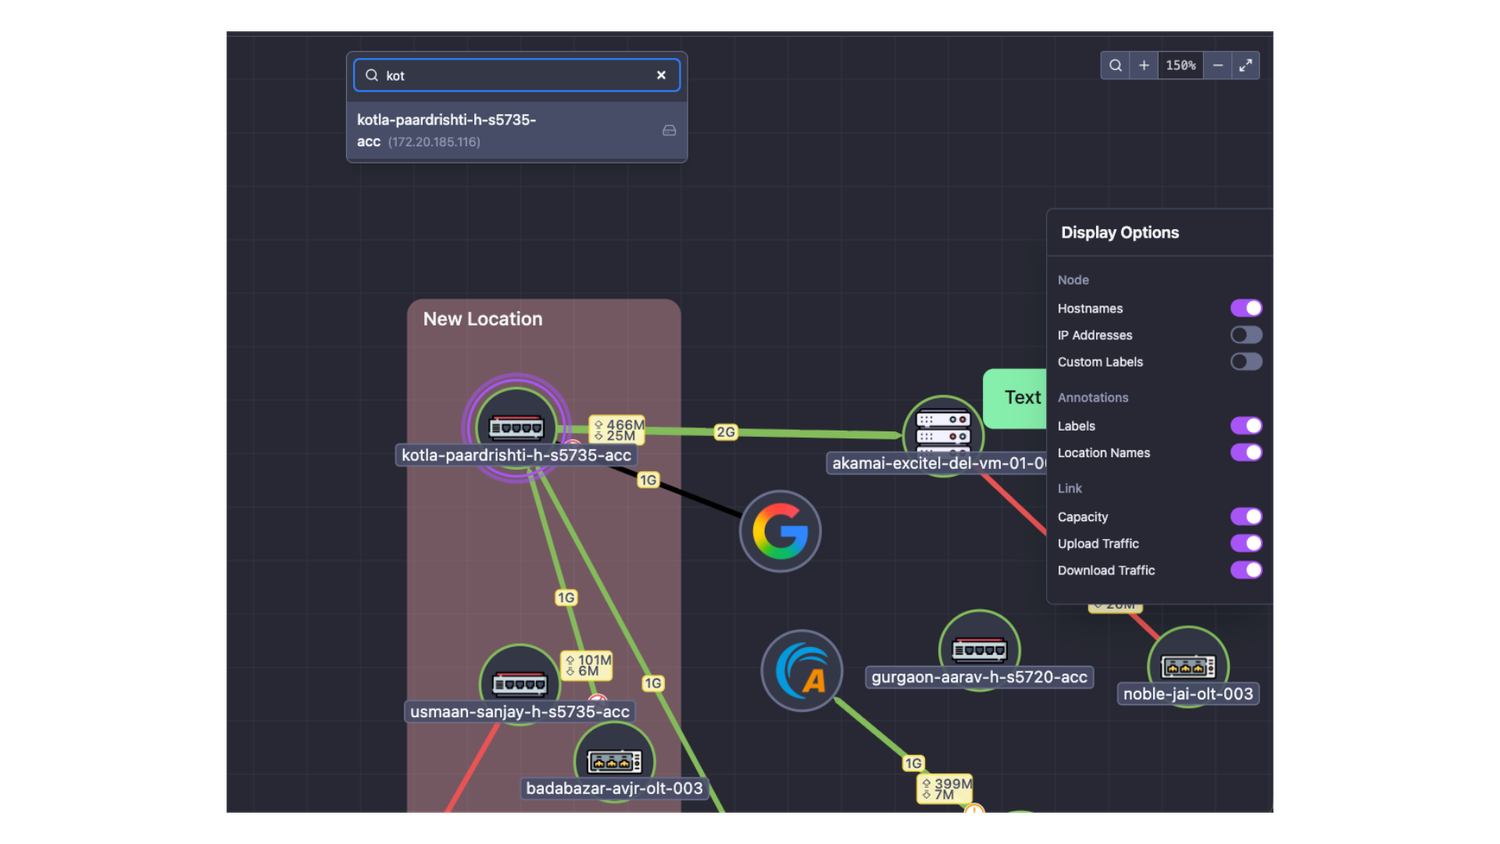
- Network Topology Map - it features several new updates and enhancements:
- Labels: A new element used to add text notations to any object on the map.
- Link Metrics: New balloons for link capacity, upload, and download provide detailed information on capacity and current utilization.
- Sidebar Controls: Provides quick, one-click control over map visibility settings.
- Node Search: Use Ctrl+F (or Cmd+F on macOS) to search for nodes by hostname or IP address; the map will automatically focus on the selected device.
- Interactive Icons: Hovering over error or discard icons displays a chart showing current values and historical data.
- Context Menu: Right-clicking a link allows you to open a dedicated link view for editing or detailed analysis.
- View Persistence: Includes map zoom level persistence and a "fit-to-screen" option.
- UI Improvements: Various small enhancements to the user interface.
Integrations
- Juniper EX series
- Cisco 9500 and 9600 series