Fiber Degrades Slowly, and Nobody's Listening
Ask any NOC engineer how fiber fails and they'll describe the dramatic version: a backhoe, a snapped drop cable, a whole PON port going dark at once. Those failures are loud. Every monitoring tool on earth catches them.
But that's not how most fiber fails. Most fiber fails slowly. A connector that wasn't seated perfectly at install. A splice that took on moisture during the monsoon. A drop cable bent a little too tight around a balcony rail. A splitter port oxidizing in a street cabinet. None of these produce an outage on day one. They produce a drift: a fraction of a dB per week, over a month or two, while every up/down check in your NMS reports green.
Then one hot afternoon the signal crosses the receiver's sensitivity floor and the ONU drops. The ticket says "sudden outage." It wasn't sudden. The link had been telling you for weeks. Nobody was listening.
Up/down monitoring is deaf to decay
The standard ISP monitoring model is binary: device up, device down, alert on transition. That model was built for routers and switches, where the failure modes mostly are binary. It maps terribly onto passive optical infrastructure.
A GPON link has a power budget. The OLT transmits at a known level, the ODN eats some of it (splitters, splices, connectors, the fiber itself), and what arrives at the ONU has to stay above the receiver's sensitivity threshold. A healthy link has margin: a few dB of headroom between where the signal sits and where it stops working. Slow degradation is the silent consumption of that margin. The link works perfectly at -22 dBm. It works at -24. It works, mostly, at -26. At -28 it's a coin flip, and the coin gets flipped by temperature swings, a flexed patch cord, or nothing at all.
By the time a binary monitor sees anything, the margin is gone and the customer is offline. Everything before that moment (which is to say, the weeks when the problem was cheap to fix) is invisible to a tool that only knows "up" and "down."
What slow death looks like in the data
Here is the pattern we keep seeing across FTTH networks, reconstructed as a composite because it repeats so reliably it might as well be a law of physics:
- Week 0: ONU installed, Rx power -21 dBm. Healthy, comfortable margin. Nobody records this number anywhere.
- Week 2: -23 dBm. A connector in the path is giving up. No alarms, because the absolute level is still within spec.
- Week 4: -25 dBm, and FEC corrected-block counts are starting to climb. The link is now working harder to deliver the same bits. Still zero customer impact, still zero alarms in a binary system.
- Week 6: -27 dBm. Speed test complaints begin. Support runs the usual script: reboot the ONU, blame the WiFi, close the ticket.
- Week 8: a 40-degree afternoon pushes the receiver past its floor. ONU offline. Truck roll, angry customer, and a technician who finds a degraded connector that would have taken ten minutes to clean and reseat at any point in the previous two months.
The frustrating part: every signal needed to catch this at week 2 was already there. The OLT knew the Rx level the whole time. The optics were counting FEC corrections the whole time. The data existed. It just wasn't being trended, baselined, or compared against anything.
Listening, in practice
This failure mode is a big part of why PON monitoring in NetSense treats optical telemetry as first-class time-series data, not a value you fetch when something's already broken. The pieces that matter for slow degradation:
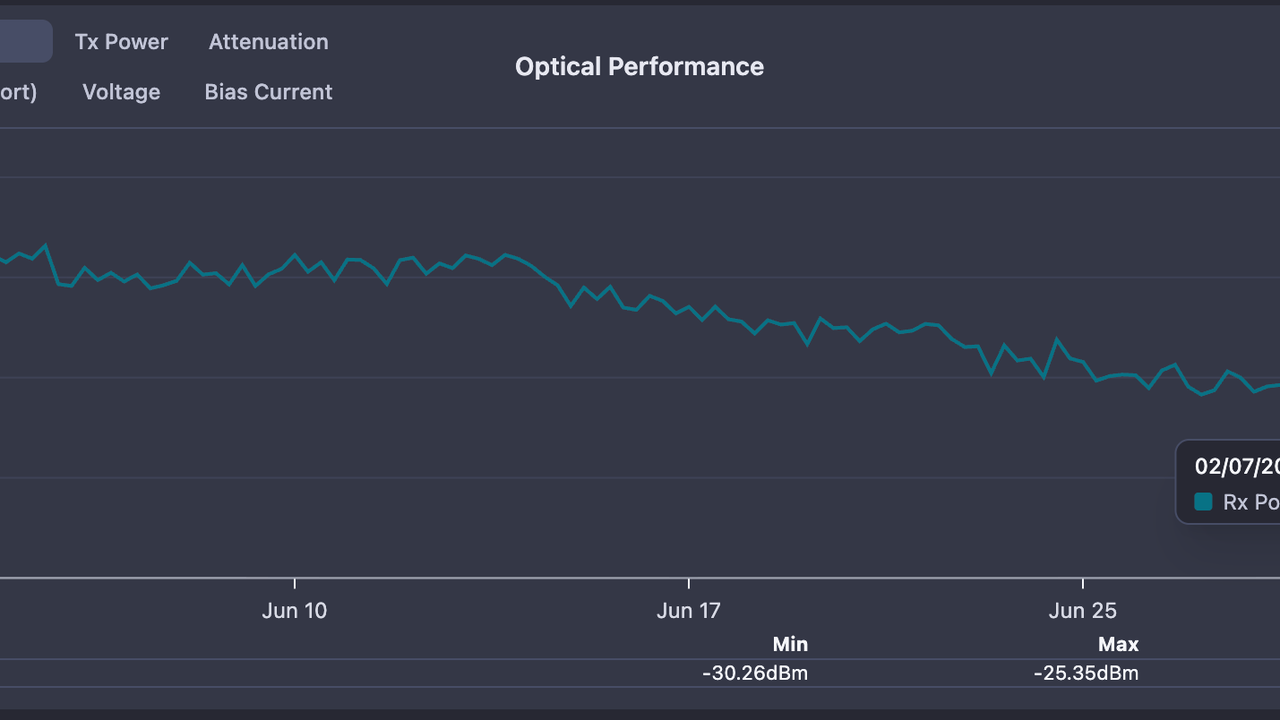
- Rx/Tx trending for every ONU: optical levels are collected and stored historically, so a six-week drift is a visible slope on a chart instead of a forgotten number from install day. Chart history is exactly what turns "it suddenly died" into "it's been dying since May."
- Baseline comparison: the fiber health check compares current signal levels against the link's own baseline. A link sitting at -24 dBm isn't inherently sick. A link that was at -21 and is now at -24 is. The delta is the diagnosis.
- Dynamic thresholds: static "alert below -27" rules catch problems late, because a link installed at -19 and a link installed at -24 reach trouble at very different times. NetSense lets you compare the current Rx power against the optic's own reported alert levels, and define custom alarm parameters on top (for example, trigger at
rx_power_threshold - 2to get a warning while there's still margin left to act in). - FEC error tracking: corrected-block counts climb well before users feel anything. Rising FEC plus falling Rx on the same ONU is about as unambiguous as fiber diagnostics get.
- Voltage and bias current: collected for PON ports and ONTs alongside the optical levels, which helps separate a dying transmitter from a dying path.
- Fleet-level Rx distribution: the OLT list now shows the ONU Rx power distribution per OLT at a glance, so you can spot the OLT whose population is skewing low before opening a single device page. One sick ONU is a customer problem. Forty ONUs drifting on the same port is an ODN problem.
And because degradation doesn't always announce which segment is at fault, the supporting cast matters too: distance estimation per ONU, PON-tree signal analysis to localize the loss to a splitter branch, and partial failure detection for the case where a degrading splitter starts dropping some ONUs while the PON port itself stays up (a failure mode we covered in detail in an earlier post). When an ONU does finally drop, the down reason distinguishes Optical Loss from Power Off, so a fiber problem doesn't hide in a pile of "customer unplugged the router" events. The dashboard's offline-ONU breakdown widget shows the same split fleet-wide, by reason and by time.
For field teams, the same data travels: the mobile view carries each ONT's optical levels, so a technician standing at a cabinet can check whether the reseated connector actually recovered the margin before driving away.
A practical playbook for optical drift
The tooling matters less than the habit. Whatever stack you run, the practice looks like this:
- Record the baseline at install. The Rx level on day one is the most valuable number in the link's life. Everything after is measured against it.
- Alert on drift, not just absolutes. A 3 dB drop from baseline is a problem at any absolute level. Static floors catch failures; deltas catch degradation.
- Watch FEC before you watch tickets. Error correction is the link complaining politely. It always complains before the customer does.
- Triage at the population level. Sort your OLTs by Rx distribution. Shared drift means shared infrastructure: a splitter, a feeder section, a cabinet. Fix one thing, recover forty customers' margin.
- Schedule the fix while it's still cheap. A degrading connector found at week 2 is a planned visit. The same connector at week 8 is an emergency truck roll plus a churn risk.
If you want to sanity-check how much margin your links should have in the first place, our free PON power budget calculator does the arithmetic.
How this gets built
Like most of NetSense, the optical trending and alarm work exists because operators (Excitel's NOC above all, where NetSense effectively grew up) kept hitting the same wall: the data was on the OLT, and the tooling threw it away. The dynamic threshold engine, the baseline comparison, the Rx distribution view all came out of that loop. It's also why the fastest path from a workaround to a feature has always been a customer email. If your team has a degradation pattern we're not catching yet, we want to hear about it.
Start listening
NetSense's free-forever tier covers up to 1,000 nodes, with no credit card and no time limit. That's enough to put real optical trending on a meaningful chunk of a small network and see what your fiber has been trying to tell you. Or book a live demo and we'll pull up signal trends on production hardware.
And if you're already a NetSense customer: open your OLT list. The ONU Rx power distribution is sitting right there.
Frequently Asked Questions
- How can I tell if fiber is degrading before it fails?
- Trend each ONU's Rx power over time and compare it against the level recorded at install. A steady drift of even a fraction of a dB per week, especially combined with rising FEC corrected-block counts, means the link is consuming its optical margin and should be inspected before it crosses the receiver's sensitivity floor.
- What causes slow optical signal degradation in FTTH networks?
- The usual suspects are a connector that was not seated perfectly at install, a splice that took on moisture, a drop cable bent too tightly, or a splitter port oxidizing in a street cabinet. None of these cause an outage on day one; they eat the power budget gradually over weeks. Also last but not least, if the fiber is overhead and the area has many fiber cuts, each splice adds to the problem.
- Why does an ONU go offline "suddenly" if fiber degrades slowly?
- The link keeps working as long as the received signal stays above the receiver's sensitivity threshold. Degradation silently consumes that margin until a temperature swing or a flexed patch cord pushes it past the floor. The outage looks sudden on the ticket, but the drift had been visible in the optical data for weeks.