
Creating alarm definitions and rules
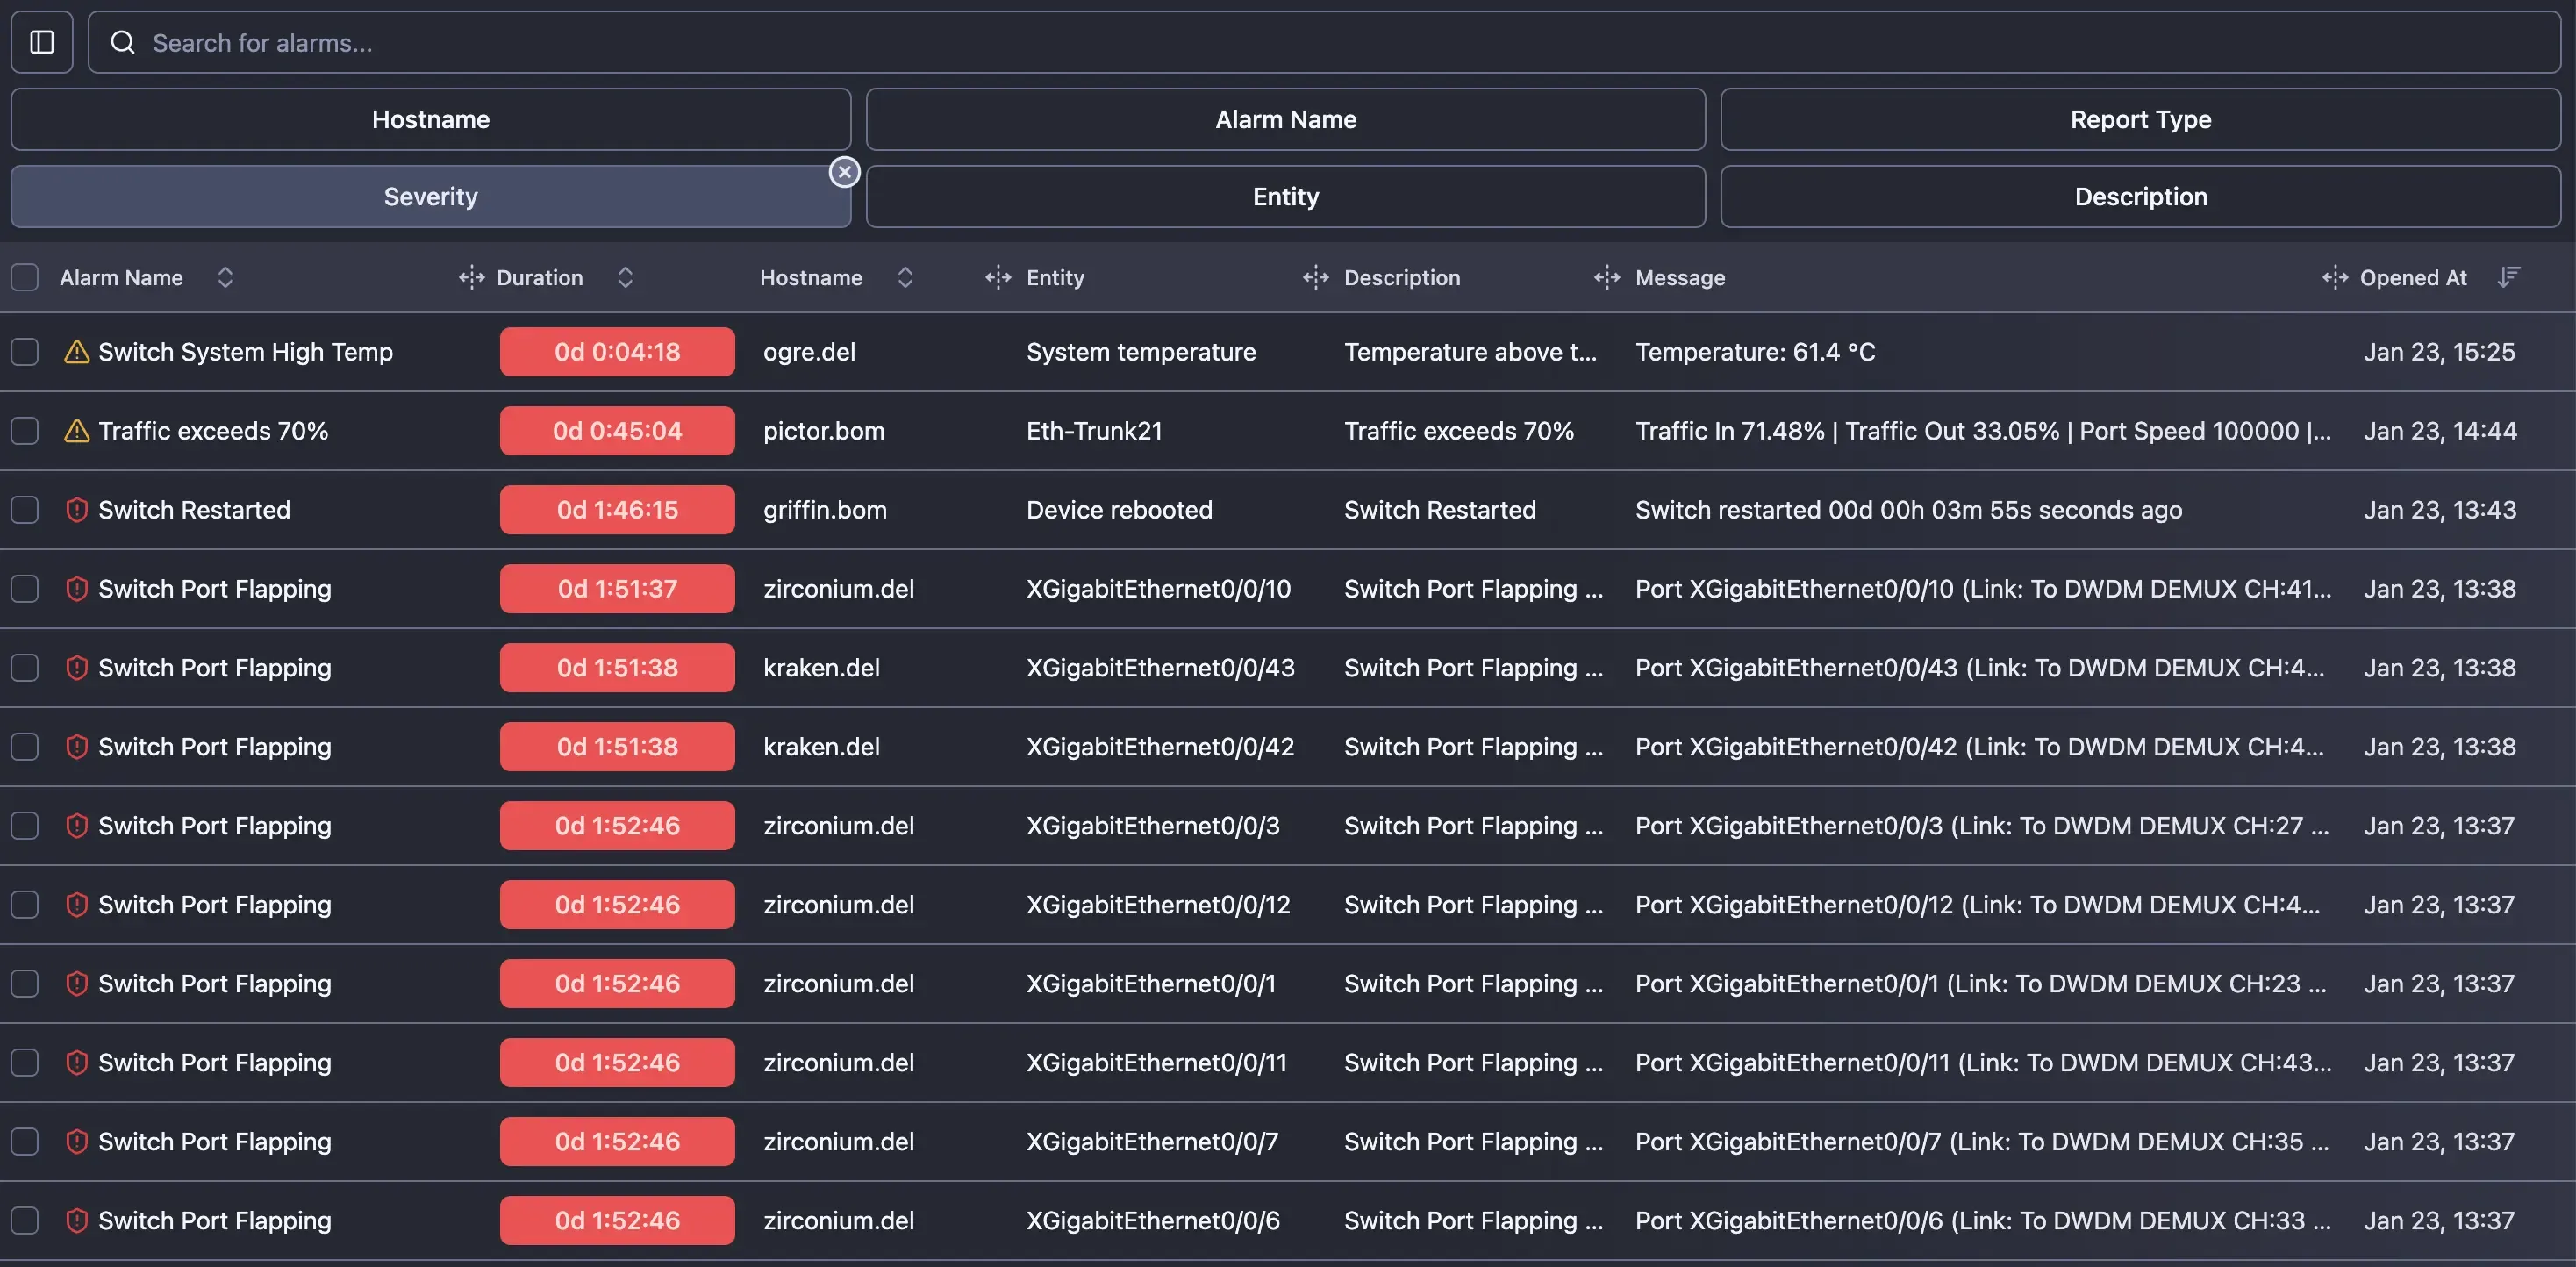
NetSense continuously collects health and performance data from every device it monitors: OLTs, switches, BNGs, servers and generic network devices. An alarm is how the system tells you that something in that data needs your attention: a link went down, an optical level drifted out of range, a device stopped responding, CPU is running hot.
You decide what “needs attention” means by creating an alarm definition: a saved rule that NetSense checks against incoming data. Whenever the rule is true, NetSense raises an alarm; when the condition clears, the alarm closes automatically. Each alarm can also be delivered to your team over Slack, Telegram, Alerta or a webhook.
Key terms
Section titled “Key terms”| Term | What it means |
|---|---|
| Alarm definition | The saved rule you create. It stays in place and is checked against every new reading. |
| Report type | The kind of thing the alarm watches (an OLT, an OLT port, a switch, a server). It decides which readings are available and cannot be changed after creation. |
| Rule | The condition that decides when the alarm fires, e.g. “temperature is at or above 60°C”. |
| Severity | Critical, Major, Minor or Warning. Used for colour-coding, sorting and routing. |
| Reading / field | A single measured value from a device or port, such as CPU load, Rx power, or port status. |
| Custom variable | A value you calculate from existing readings and use in a rule or message. |
| Relay | A notification channel (Slack, Telegram, Alerta, webhook) an alarm can be sent to. |
| Alarm delay | A grace period before a newly-triggered alarm becomes active. |
| Keep-alive | A minimum time an alarm stays open once raised. |
What you can monitor
Section titled “What you can monitor”The readings available depend on the report type you choose. Device-level alarms watch the device as a whole; port-level alarms are evaluated separately for every port.
- Device health (OLT, Switch, BNG, Server, Generic): device status, SNMP status, ping packet loss and latency, previous ping loss, CPU load, memory load, temperature, uptime, power supply status.
- Server-specific: disk utilization and free space, disk read/write rates, physical, virtual, swap and available memory, per-core CPU utilization, OS and architecture.
- Ports and interfaces (OLT, Switch, BNG, Server ports): port status and flap counts, traffic in/out and utilization, errors and discards, unicast/multicast/broadcast packet rates, optical readings (Rx/Tx power, temperature, voltage, bias current, plus the vendor’s own low/high thresholds), media type and description.
- PON / ONU readings (OLT ports): active/registered/max ONUs, down ONUs (total, optical loss, not powered off), port fill, active ONU deviation from baseline.
- Coherent optics (Switch ports): laser frequency, OSNR, uncorrected FEC, laser age.
Creating an alarm, step by step
Section titled “Creating an alarm, step by step”Open Alarms → Definitions and choose Create. You can also duplicate an existing definition and tweak it, often the fastest way to start.
- General: name (e.g. “OLT CPU High”), severity, report type (locked once created, so choose carefully), optional alert delay and keep-alive, description, and the message shown when the alarm fires.
- Custom variables (optional): calculated values to use in the rule or message.
- Rules: build the condition with the visual rule builder.
- Relays (optional): pick the notification channels this alarm should go to.
When you save, NetSense validates the rule and checks that every reading you referenced exists for the chosen report type. From that moment the alarm is live.
Building the rule
Section titled “Building the rule”A rule is one or more conditions combined with AND / OR logic. Each condition compares a reading to a value, or to another reading.
Temperature >= 60 -> fires when temperature reaches 60°CPort status = Down -> fires when the port is downCPU load > 85 -> fires when CPU is above 85%- AND: every condition in the group must be true (narrower, fewer alarms).
- OR: any one condition is enough (broader, more alarms).
- Groups can be nested for precise logic, e.g. “status is Down AND recent ping loss was high”.
A sustained packet-loss example that ignores both brief blips and total outages:
ALL of the following (AND): ping loss > 20 ping loss < 90 previous ping loss > 20 previous ping loss < 90Comparing one reading to another
Section titled “Comparing one reading to another”Instead of a fixed number you can compare a reading to another reading. This is ideal for optics, where devices report their own thresholds:
Rx power < Rx low warning thresholdThe alarm fires when the received light drops below the vendor’s own warning level, no hard-coded number needed, and it adapts per port.
Match conditions vs filter conditions
Section titled “Match conditions vs filter conditions”The real power of the rule builder is combining match conditions (what to alarm on) with filter conditions (what to ignore). A refined Switch Port DOWN alarm that only fires for real physical ports:
ALL of the following (AND): status == Down (the port is down) type == Ethernet (only real, physical ports) name not_contains tunnel (ignore tunnel interfaces) name not_contains docker (ignore Docker virtual bridges) name not_contains br- (ignore Linux bridges) name not_contains virb (ignore libvirt virtual bridges)The first two lines select what you care about; the not_contains lines drop virtual and
logical interfaces that are “down” by design and would otherwise flood you with noise. Add
one not_contains line per naming pattern you want to exclude.
Filtering by hostname or description
Section titled “Filtering by hostname or description”hostname (the device a port belongs to) and description (the interface description
configured on the device) are the two most useful filter fields. Text fields support full
matching (==, !=) and partial matching (contains, not_contains, case-insensitive):
One specific device: hostname == core-sw-01Every device in a site: hostname contains sof-Only customer-facing ports: description contains customerExclude uplink/transit ports: description not_contains uplinkPorts with no description: description == (empty value)Putting it together, a precise alarm for high inbound utilization on customer aggregation ports at one site:
ALL of the following (AND): hostname contains sof-agg (site + role) type == Ethernet (physical ports only) description contains customer (only customer ports) description not_contains test (exclude test ports) utilization_in > 90 (over 90% inbound)Custom variables
Section titled “Custom variables”When the value you care about isn’t reported directly, build it. A custom variable is
calculated from existing numeric readings with +, -, * or / and then used in rules
and messages like any other reading.
custom variable: adjusted_threshold = cpu_threshold + 5rule: cpu load >= adjusted_thresholdmessage: "CPU {{cpu_load}}% is above {{adjusted_threshold}}%"Give it a short name (letters, numbers, underscores, starting with a letter), optionally a unit. A custom variable can use device readings but not other custom variables.
Alarm messages
Section titled “Alarm messages”The message is the text you see when the alarm fires and what is sent to your notification channels. Insert live readings so every alarm tells you exactly what happened, on which device:
OLT {{hostname}} ({{ip_address}}) is DOWNPort {{name}} Rx power: {{rx_power}} dBmrenders as:
OLT edge-olt-07 (10.20.1.4) is DOWNPort GPON0/3 Rx power: -27.4 dBmNotifications (relays)
Section titled “Notifications (relays)”A relay is a channel that delivers alarms to your team. NetSense supports Slack, Telegram, Alerta and generic webhooks. Relays are configured once, then attached to any alarm definitions that should use them. An alarm can notify several channels at once, and the selector shows whether each relay is currently running.
What gets sent: a notification when the alarm is raised, one when it clears (if the definition announces closures), and periodic reminders while a long-running alarm stays active.
Next steps
Section titled “Next steps”Alarm delay and keep-alive decide when an alarm opens and how long it stays open. Getting them right is the difference between a quiet, trustworthy alarm list and a noisy one; see Alarm timing and lifecycle.