
Building network maps
Network maps turn the inventory into a picture your NOC can reason about: which ring feeds which hub, where the traffic actually flows, and what just went dark. Operators run maps per city, per ring or per region, and during an incident the map is usually the first screen open.
Links first, then the map
Section titled “Links first, then the map”The topology is built from device links. Create the links between your devices (device+port on side A, device+port on side B) from a device’s Links tab; without links, there is nothing to draw. For operators using NetBox, links and circuits sync from there (one way, NetBox to NetSense) and stay authoritative in NetBox. The links list can be searched and filtered by Provider and External ID, which is how you find one circuit among hundreds.
Once links exist you get two kinds of map:
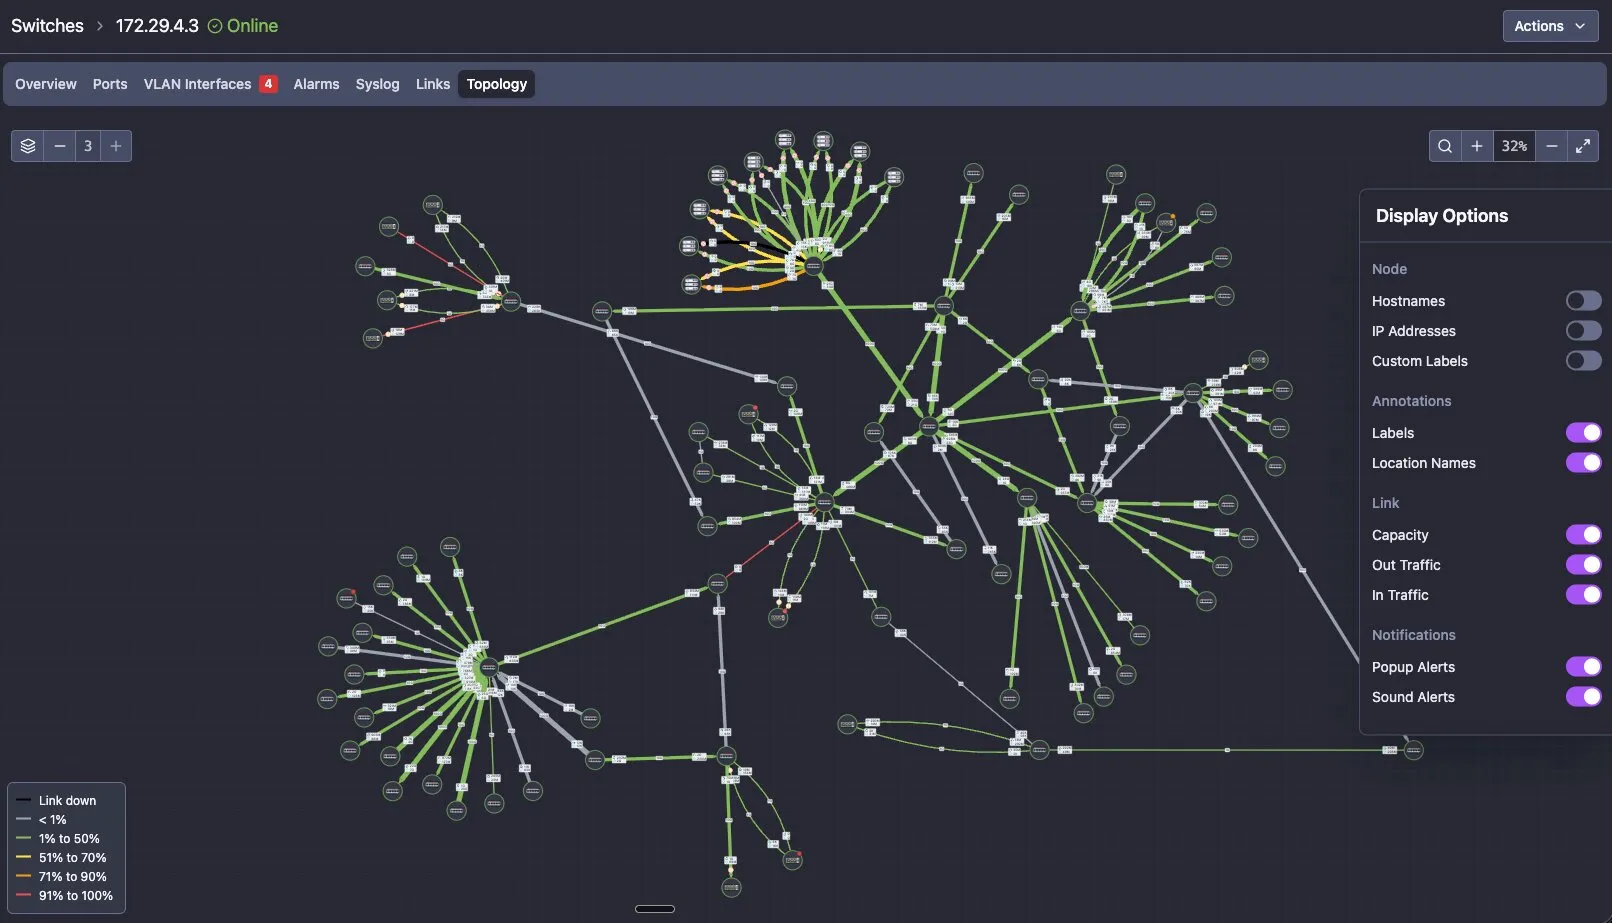
- Dynamic maps need no drawing at all. OLT and switch pages have a Topology tab that draws the device and everything connected to it, as many hops out as you set with the depth control in the top-left corner. It is the fastest way to see the state of one segment during an incident, and it has every feature of a manual map: utilization colors, device and link status, live traffic, Display Options.
- Manual maps are the ones you lay out yourself under Network Maps → New Map: the wall-screen map of a city or a ring, arranged the way your team thinks about it. Devices and links come from the inventory; the layout, the groupings and the notes are yours.
Full SNMP/LLDP auto-discovery of topology is on the roadmap; today NetSense draws the links you (or your NetBox) declare. In practice operators map their core and aggregation first, a few dozen links, and get most of the value.
Custom nodes: mapping what isn’t yours
Section titled “Custom nodes: mapping what isn’t yours”The far end of a link isn’t always your device: an upstream transit, a peering fabric, a CDN cache. For those, add a custom node with a virtual port as the Z side and link your real device+port to it. A single custom node supports multiple links, so “all my uplinks toward provider X” can converge on one node. This keeps edge traffic visible on the map without pretending you manage the other end.
What’s on the map
Section titled “What’s on the map”A manual map’s header counts its nodes, links, locations and labels, and the links counter also shows how many links are currently down, so a glance at the header tells you whether the map needs opening.
Beyond devices and links, two kinds of element make a map readable at a glance:
- Locations are named boxes you draw around a group of nodes: a POP, a building, a ring. They give the eye something to hold on to in a map of a hundred switches.
- Labels are free text attached to any object, for the notes that otherwise live in someone’s head: “fiber via the highway”, “temporary 1G until the 10G optics arrive”.
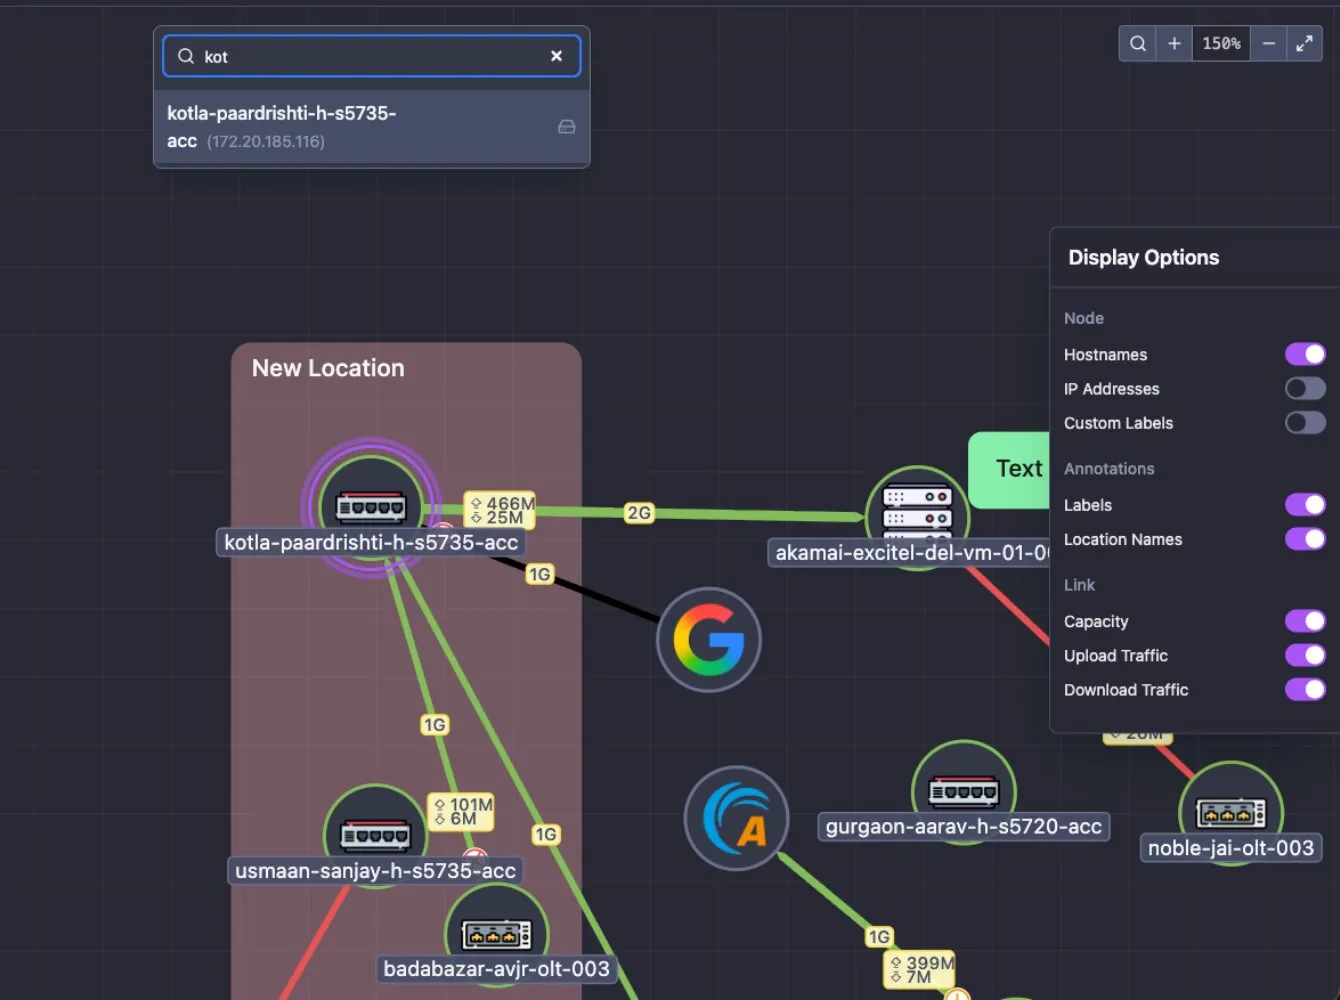
The Display Options panel (the gear on the right edge of the map) toggles what is drawn: hostnames, IP addresses and custom labels on nodes; labels and location names; capacity and in/out traffic balloons on links; and the map’s popup and sound notifications. Ctrl+F (Cmd+F on macOS) searches nodes by hostname or IP address and focuses the map on the match. Clicking a link highlights it together with the two devices it connects; clicking a device highlights the device and all of its links, which is how you follow one path through a crowded map. The zoom level persists between visits, and fit-to-screen brings the whole map back after you have wandered.
Reading the map
Section titled “Reading the map”- Link colors follow utilization, so a filling ring changes color before it becomes a problem: grey below 1%, green up to 50%, yellow to 70%, orange to 90%, red above that. Down links are black. The legend sits in the bottom-left corner of every map.
- A link whose capacity can’t be determined (a port reporting
speed: 0, or both ends on auto-negotiation) is drawn in purple and black stripes, with a tooltip saying why. Fix the speed at the source (device or NetBox), or set the link’s capacity manually, and it resolves.
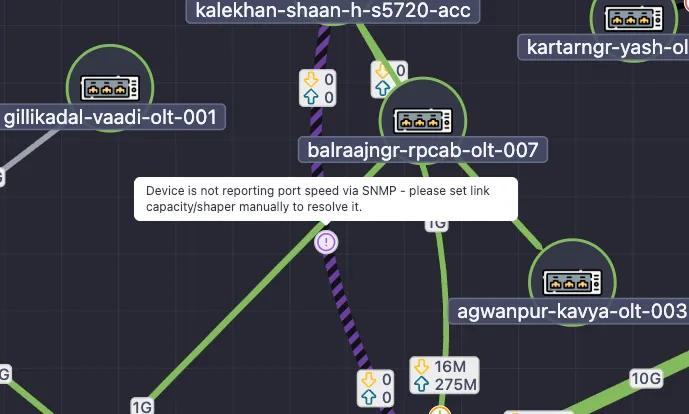
- Link balloons show capacity and the current in and out traffic on the link itself. In edit mode they are draggable, so on a busy map each one can be moved to where it is readable.
- Hovering a link shows its traffic graph in place; graphs support custom time ranges and render interactively (about 1,440 points for 24 hours). Device and port down events are annotated on the graph, so a dip lines up with its cause.
- Where data has gaps (a device was down or unreachable), graphs show an annotated gap rather than drawing a line across the hole, so an outage doesn’t get visually papered over.
- When a node or link changes status or capacity it blinks three times, and the change is logged as a stacked message in the bottom-right corner. With the map open, events play a sound, and per-map toggles control popup and sound notifications, so the wall-screen map can be loud and your personal one quiet.
- Right-clicking a link opens its dedicated link view for editing or a closer look.
Editing layout
Section titled “Editing layout”In edit mode, links have draggable control points for routing them around each other: Cmd/Ctrl-click to multi-select points, right-click to delete one, and Cmd/Ctrl-drag to area-select and move whole groups. Ten minutes of layout work is what turns an auto-arranged graph into the map your NOC actually recognizes.
Practical tips
Section titled “Practical tips”- One map per operational unit (city, ring, region) beats one giant map: faster to read, faster to load, and it matches how your team divides responsibility.
- Deleting a map is recoverable. A manual map keeps its Versions (the button next to Edit), and a deleted map can be brought back from Network Maps → Restore Maps with its last version. Deleting asks you to type the map’s name first, so it doesn’t happen by accident.
- Watch for duplicate or incomplete maps while several people are editing, agree on who owns which map.
- Links heal themselves when a port comes back. If a port was removed by inactivity and later reappears, NetSense re-attaches the links that referenced it, in the links list and on maps. A device you delete and re-create is a different object, though: after that, edit any map that contained it and re-attach the node.
- If a map or map option looks missing right after a platform update, hard-refresh or re-login before suspecting a bug; maps are the screen most sensitive to stale browser state.
- Pair each map with a custom dashboard of the same scope (the ring’s key ports on one pane) and you have both the picture and the numbers for that slice of network.