
Building custom dashboards
The built-in dashboards show the network the way NetSense thinks about it: all devices, OLTs, switches, BNGs, servers. A custom dashboard shows it the way your team thinks about it: the uplinks that carry a city, the peering ports next to the transit ports, the one trunk everybody worries about. You choose the charts, group them into sections, and the result stays open on the NOC wall instead of being hunted for across device pages.
Where they live
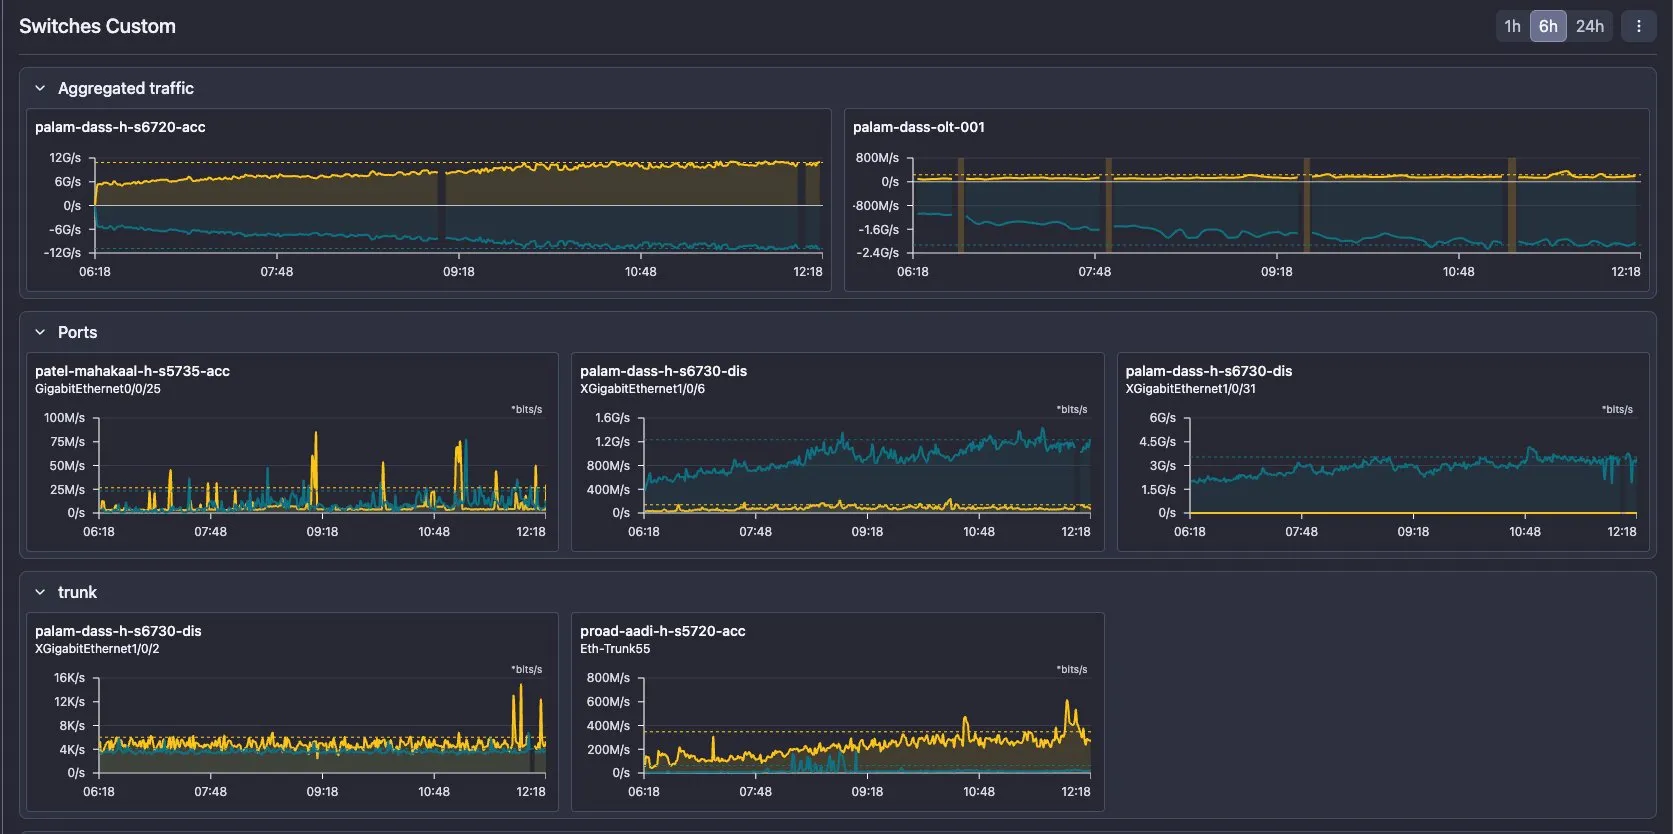
Section titled “Where they live”Custom dashboards sit next to the built-in ones. The Dashboard page has a row of tabs at the top (All Devices, OLT Overview, Switch Overview and so on); every custom dashboard you create is listed under More at the end of that row, and the + button in front of the tabs creates a new one. In a tenant with several regions, dashboards belong to the region you are working in.
What goes on a custom dashboard
Section titled “What goes on a custom dashboard”Every chart on a custom dashboard is a bandwidth chart, bits per second in and out, for one of three things:
- A port. Any switch, OLT, BNG or server interface NetSense polls: uplinks, trunks, LAGs, the port toward a particular customer or partner, either end of a link.
- A VLAN interface. The traffic of an OLT or switch VLAN interface, for the cases where a service or an LCO is a VLAN rather than a physical port.
- A device’s aggregated traffic. The sum of all ports on a switch, or all PON ports on an OLT: the same aggregate chart as on the device’s Overview, without opening the device.
Charts are grouped into sections. Each section has a name, a column count of its own (one to four charts per row), and collapses with one click, so a section with a handful of ports reads in a single glance. Every chart is titled with the hostname and the interface name, with the interface description underneath, which is what makes “XGigabitEthernet1/0/6” mean something to the person on shift.
Two controls at the top right apply to the whole dashboard. The range selector switches every chart between the last hour, six hours and 24 hours. The auto-refresh interval (off, or every 1, 3, 5, 15 or 30 minutes) is what keeps a wall screen current without anyone touching it. Hovering a chart shows the exact in and out values at that moment, and gaps in the data (a device that was unreachable) are shown as gaps rather than drawn across.
Creating a dashboard
Section titled “Creating a dashboard”-
On the Dashboard page, click + (Add Bandwidth Dashboard) and give the dashboard a name that says what the screen is for: “Kota core”, “Upstream and peering”, “NOC wall”. A purposeful name beats “Dashboard 1” once there are six of them.
-
Click Add Section, name it (“Aggregated traffic”, “Uplinks”, “Trunks”, “Caching”) and choose how many columns it gets. Two columns is the default; four suits a wall of small charts, one suits a single chart you want large.
-
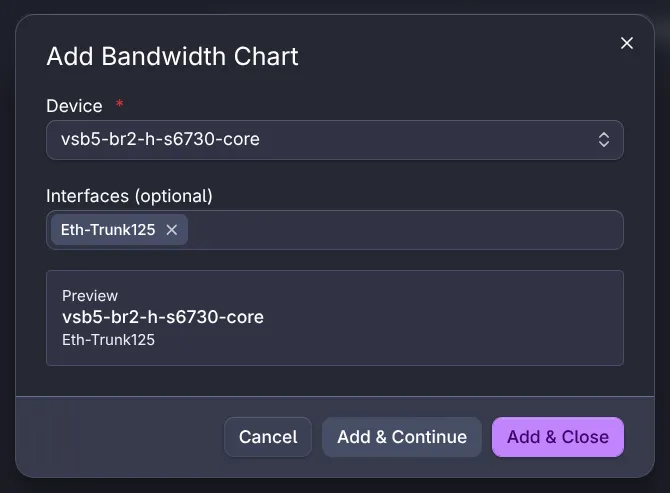
In the section header, click Add Chart. Pick the device (the search covers OLTs, switches, BNGs and servers), then optionally one or more interfaces. The interface list is grouped into ports and VLAN interfaces, shows each one’s status and description, and filters as you type. Leave the interfaces empty to chart the device’s aggregated traffic instead. The preview under the fields shows what you are about to add.
-
Add & Continue adds the chart and keeps the dialog open for the next one; Add & Close adds it and returns to the dashboard. Selecting several interfaces at once adds one chart per interface, which is the fast way to fill a section with all the uplinks of one switch.
-
Add more sections and charts the same way, then Save Dashboard. It appears under More and opens like any other dashboard.
While editing, every section has a drag handle for reordering, an editable name, its column selector and a delete button; every chart tile has its own drag handle and remove button, so a dashboard can be rearranged without rebuilding it.
Editing, renaming and deleting
Section titled “Editing, renaming and deleting”The ⋮ menu at the top right of a custom dashboard offers Edit, Rename and Delete. Edit reopens the same editor in place, with Cancel and Save at the top, so adding a port to an existing section or changing a column count takes a few seconds. If you would rather start from something than from a blank page, NetSense support can seed an example dashboard in your tenant for you to rename and expand.
Dashboards operators actually build
Section titled “Dashboards operators actually build”- One screen per city or site. The core switches, the BGP routers and the top OLTs of one city on a single pane, so city-level health is visible without navigating device by device. For a multi-site ISP this is the recommended first dashboard.
- Upstream and peering side by side. The ILL ports in one section and the IX or PNI ports in the next, so a transit spike and the peering dip that caused it sit next to each other.
- One dashboard per traffic source. Caching, HTTP, IPTV, P2P: a section per cache cluster or per platform, with the trunks that feed it, tells you at a glance whether a slow evening is the cache or the transit.
- The trunk watch list. The handful of inter-switch trunks and LAGs whose saturation would page someone at night, watched during the day instead.
- The map’s companion. Pair each network map with a dashboard of the same scope: the map gives the picture and the status, the dashboard gives the numbers for the ring’s key ports.
- A dashboard for the person who asks. When a manager or a partner keeps asking about the same three links, build them a dashboard with exactly those three links.
What a custom dashboard can’t do yet
Section titled “What a custom dashboard can’t do yet”- Traffic is per interface. Per-subscriber (per-ONU) traffic is not available on dashboards yet; for one ONU, the live traffic view on the ONU page is the place. Per-ONU dashboard charts are a known request and on the development list.
- Charts are bandwidth charts. Errors, discards, optical levels, CPU and alarms stay on the device pages and the built-in dashboards; a custom dashboard is for watching traffic.
- Per-dashboard permissions are in development. Until they land, treat a custom dashboard as visible to the tenant rather than to a chosen group of users.