
Huawei traffic graphs show artificial spikes
Symptom
Section titled “Symptom”The traffic graph of a Huawei switch shows a regular comb pattern: short spikes at roughly double the real traffic level, alternating with dips, repeating every few minutes. Both directions (IN and OUT) show the same pattern. The device is otherwise healthy and utilization reported elsewhere looks normal.
A typical example, where real traffic is around 4.6 Gbps but the graph spikes to 9.69 Gbps:
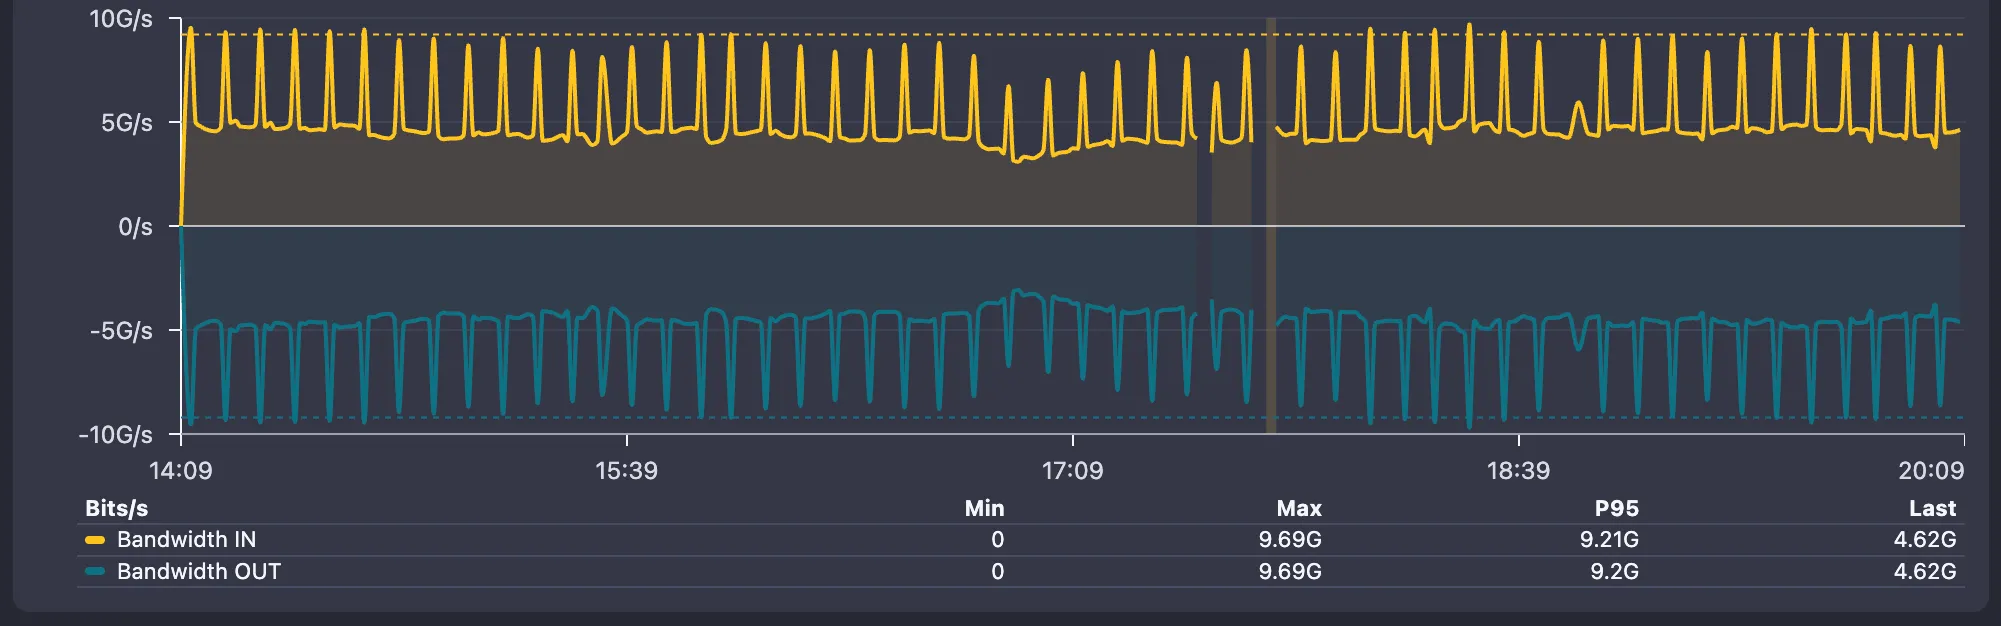
A quick way to recognize it: the Max value is close to exactly 2x the Last/typical value, and the spikes are perfectly regular. Real traffic bursts are never that periodic.
NetSense polls interface counters about once per minute. On Huawei S-series switches the IF-MIB interface counters are not updated in real time by default: the switch refreshes them on its own internal schedule. When a poll lands before the refresh, it reads a stale value (a dip in the graph). The next poll then reads roughly two intervals worth of traffic at once (a spike).
This is a display artifact of the counter sampling, not real traffic. The switch is not experiencing these bursts.
Affected devices
Section titled “Affected devices”Huawei S-series switches, including the S5720, S5735, S6720 and S6730 families. The default counter refresh behavior varies by model and software version, which is why some units on the same network show the pattern and others do not.
Tell the switch to update IF-MIB counters on request instead of on the delayed schedule. On the switch CLI:
system-viewset if-mib sample-interval 0saveGraphs settle within 10 to 15 minutes; no reboot and no polling change on the NetSense side is needed.
Apply the same command to every Huawei switch that shows the pattern. It is safe to roll out fleet-wide on the affected families.
If the command is rejected
Section titled “If the command is rejected”-
Some models and software versions do not accept the
setprefix. Try the same command without it:if-mib sample-interval 0 -
Older models on old software (for example S5720-36C-EI on V200R011) may not support the command at all. Collect the output of
display versionand contact NetSense support; we track workarounds per model and firmware.
Verify
Section titled “Verify”After 10 to 15 minutes the graph should show a steady curve that matches the real load, with the comb pattern gone and Max no longer sitting at double the typical value.