
See Your Entire Network. In One View.
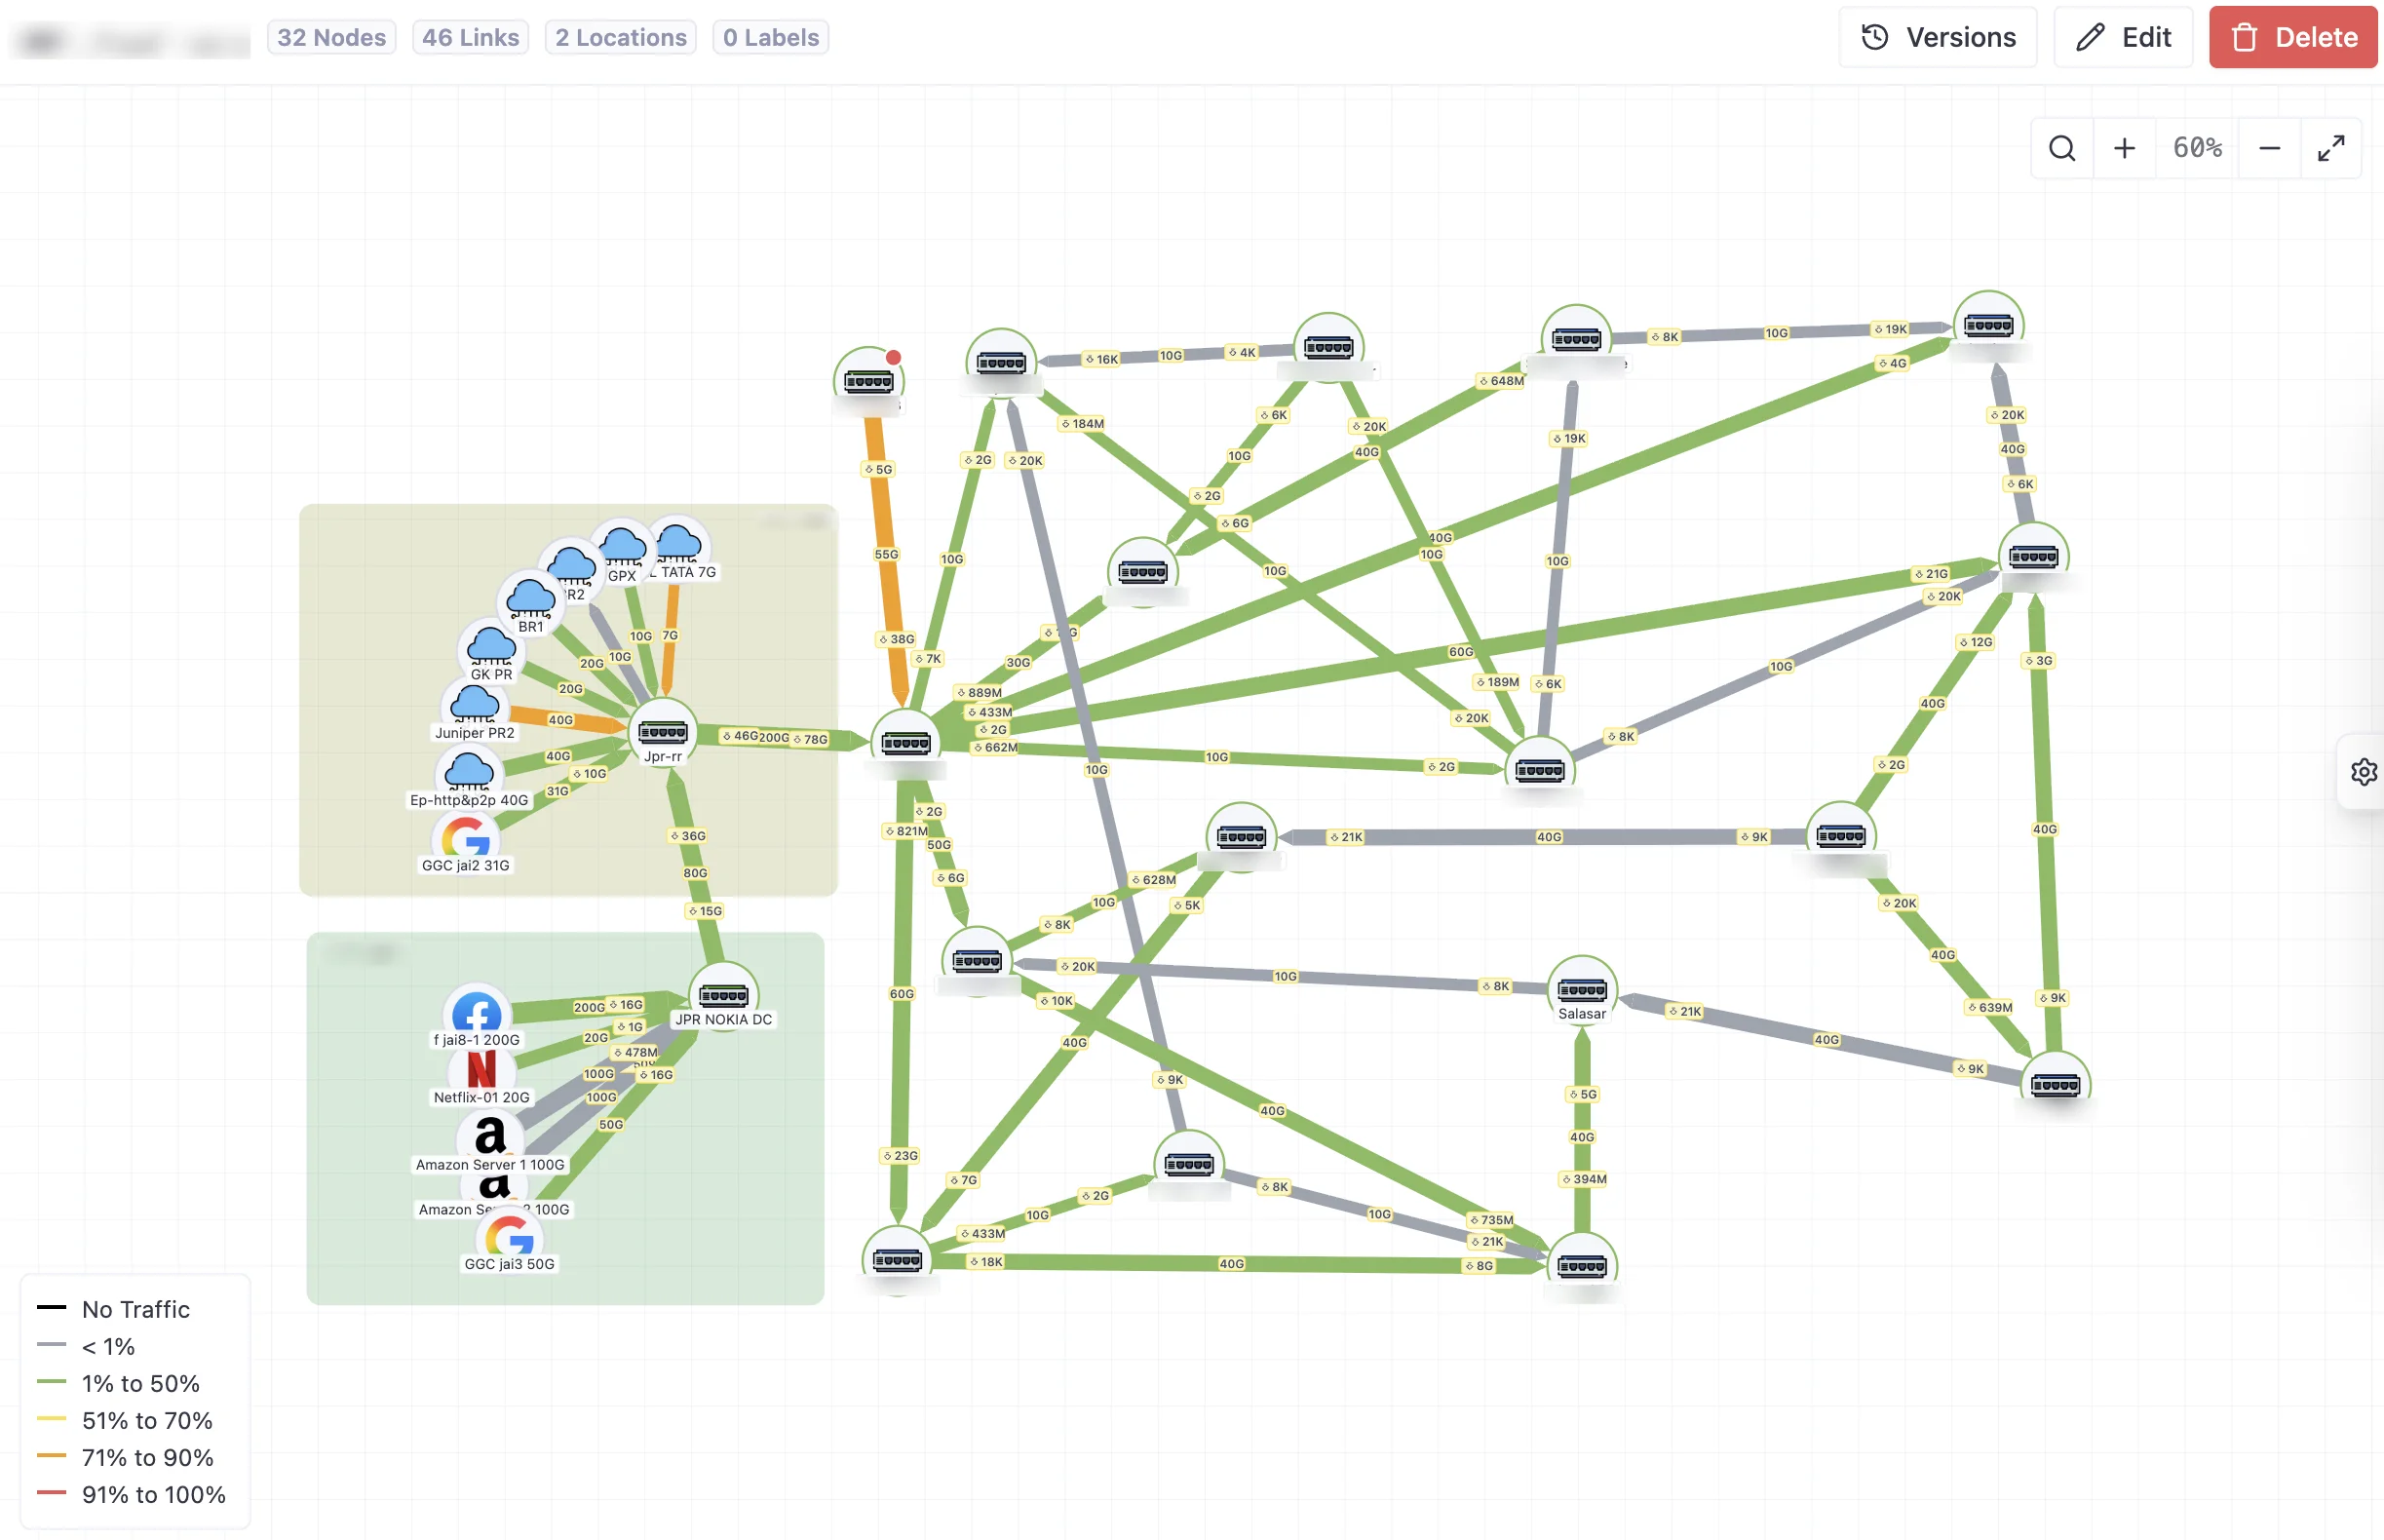
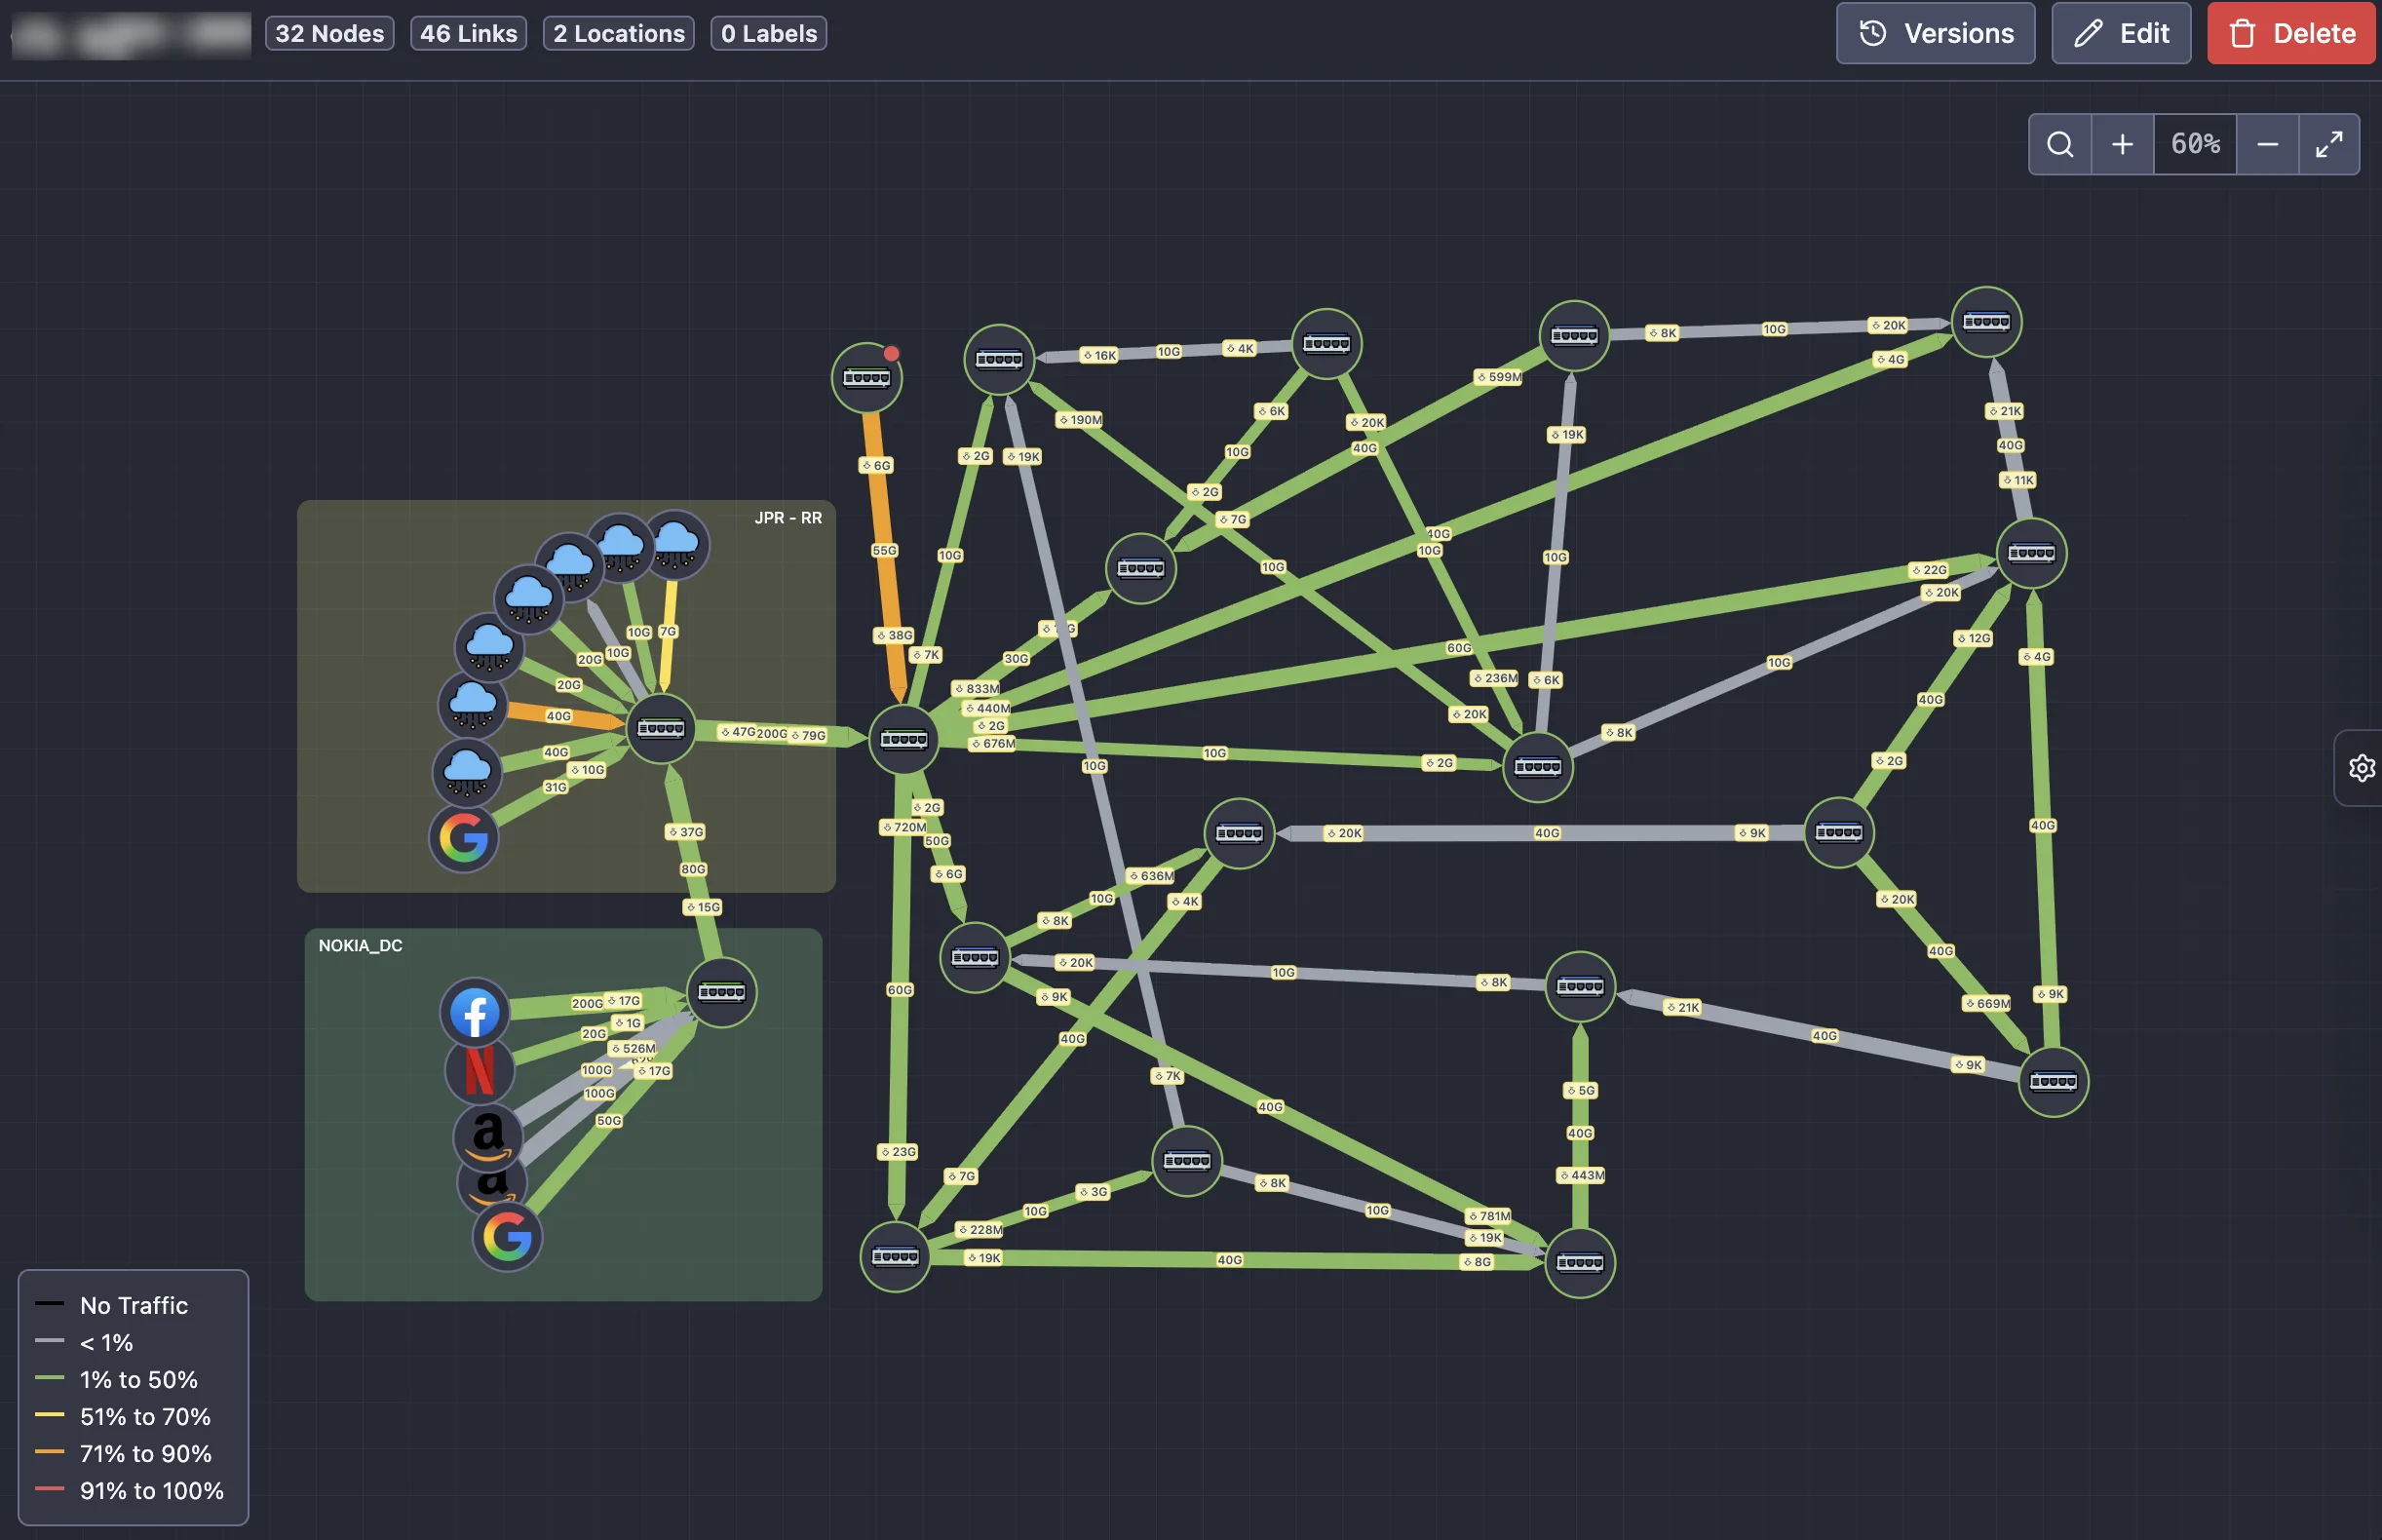
Built to Replace Weathermap
Weathermap earned its place on NOC screens, but keeping it alive means brittle config files, a static image, and a map nobody wants to touch in case it breaks. The NetSense Network Map is drawn in the browser, runs on the same live telemetry and alarms as the rest of NetSense, and keeps a version history, so anyone on the team can edit it safely.
Extreme IX and Excitel have fully retired Weathermap.
The Network Map is the daily driver for both NOCs: on the wall displays, during incidents, and in peering reviews. It is available on every NetSense plan, including Free.
Read more: Network Map, six months in and the launch post.
Building the map
Weathermap: Text config files, edited by hand
NetSense: Drag-and-drop editor in the browser, right-click to add nodes and links
Data on the map
Weathermap: Static image, redrawn on each poller run
NetSense: Live link utilization, in and out traffic, and alarm state from NetSense polling
Faults
Weathermap: Utilization colors only
NetSense: Alarm severity on every node, down links, and port error and discard markers
Link inventory
Weathermap: Defined again inside each map
NetSense: Device Links reused on every map, or synced one-way from NetBox
Changing a map
Weathermap: Back up the config and hope
NetSense: Saved versions, visual diff, restore, and recovery of deleted maps
Per-device view
Weathermap: Draw another map
NetSense: Topology tab on every OLT and switch, generated on demand
Two Ways to See Your Topology
Curated maps for the views your team looks at every day, and dynamic maps for the moment you need to know how one device connects to everything else.
Designed once, used every day
Network Maps
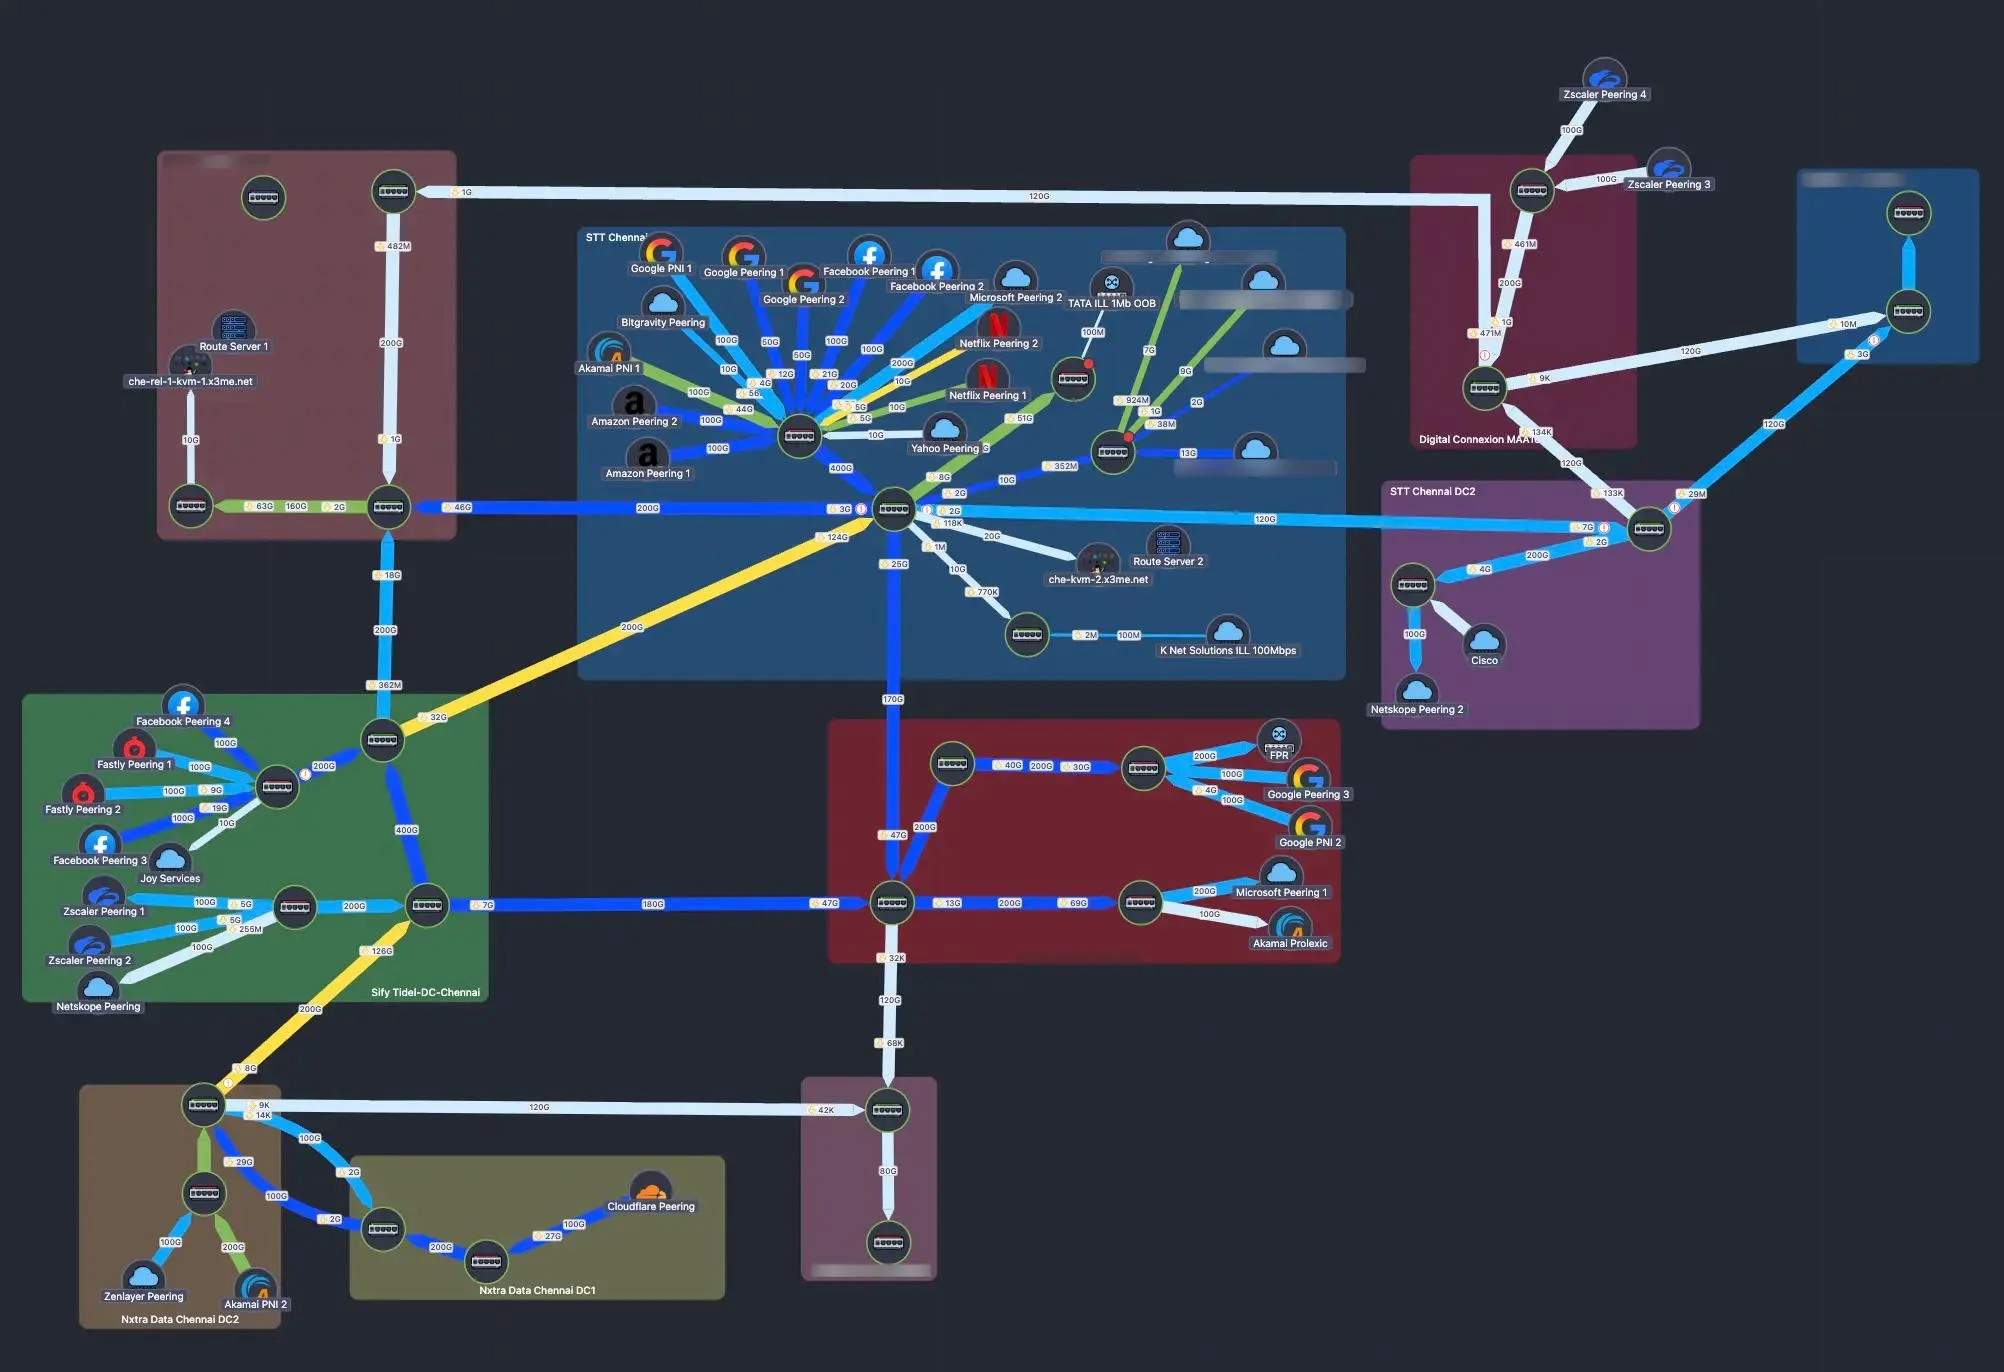
The maps your NOC puts on the wall. You decide the layout; NetSense keeps every link and node live.
- Place every node where it makes sense, with curved links routed around clusters
- Group sites, POPs, and data centers into colored Locations, and add text labels
- Custom icons for peers, CDNs, and upstreams: Google, Facebook, Netflix, Akamai, Cloudflare, Microsoft, Zscaler, Fastly, and more
- Copy a map to build a peering view, a POP view, or a wall-display view
- Fullscreen mode with no page chrome for NOC wall screens
Generated on demand
Dynamic Topology
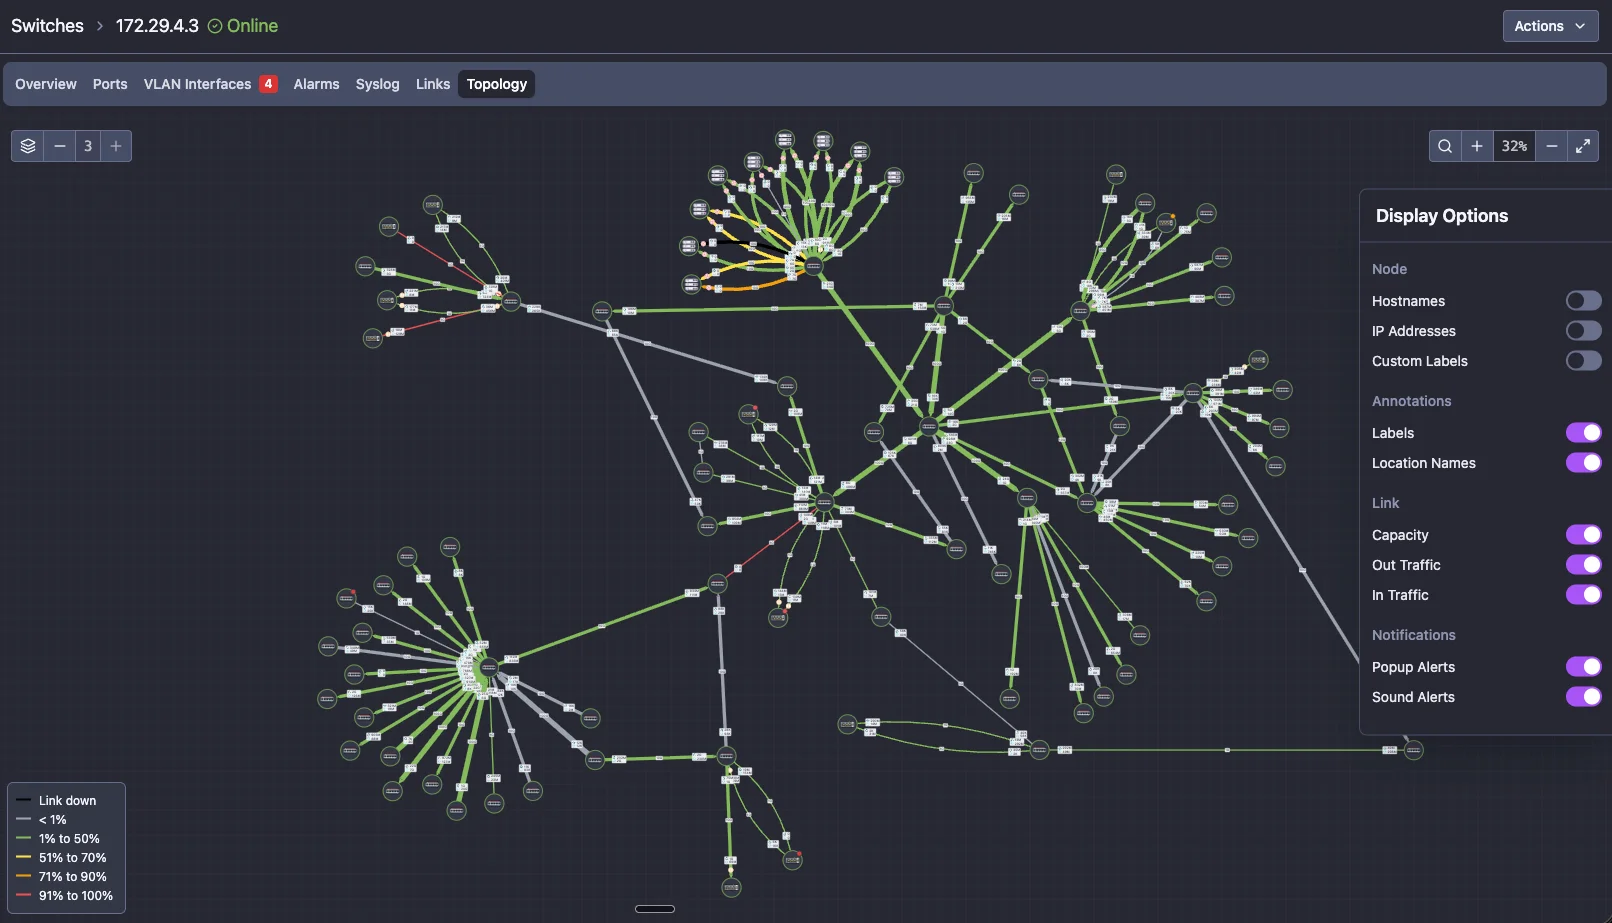
When you are chasing a partial outage at 3 a.m., there is no time to draw a map first. NetSense builds one around the device you are looking at, from the links it already knows.
- Open the Topology tab on any OLT or switch and the view is drawn for you
- Set the hop depth to see further out from the device
- Click a link or device to highlight it; the source device stays highlighted
- Same live utilization, status, and traffic as the manual maps
- Grows automatically as you add Device Links or sync more from NetBox
Everything on the Map Is Live
The map is not a picture of your network. It is an operational screen, fed by the same polling and alarms that run the rest of NetSense.
Utilization at a glance
- Links colored by utilization against your own thresholds
- Link width scales with capacity, with 1G, 10G, 100G labels
- In and out traffic balloons with direction arrows
- Links with an unknown speed are striped, so they cannot hide
Faults you cannot miss
- Every node shows its most severe active alarm
- When a device goes down, all of its links turn the down color
- A node or link blinks three times when its state changes, with a timestamped message and optional sound
- Port error and discard markers; hover for current and historical values
- The map header counts how many links are down right now
One link inventory
- Device Links: internal and external links, defined once and reused on every map
- One-way NetBox sync of links, circuits, and virtual machines (NetBox 4.5 supported)
- Search links by provider or external circuit ID
- Links reattach on their own when a missing port comes back
Dig in from the map
- Hover a link for its live traffic chart, with device-down and port-down events marked
- Link tooltips show both ends: device, port, and description
- Right-click a link for port details or live traffic on the A or Z side
- Ctrl/Cmd+F jumps to any node by hostname or IP
- Show or hide hostnames, IPs, labels, capacity, and traffic per map
Maps that match your whiteboard
- Right-click the canvas to add a node, or a node to add a link
- Select several nodes and move them together
- Curved links, colored Locations, text labels, and a growing icon library
- Custom nodes for peers, clouds, and anything NetSense does not poll
Edit without fear
- Every save is a version you can restore
- Visual diff shows exactly which nodes and links changed between versions
- Deleted maps can be restored
- Permanent deletion requires typing the map name to confirm
Your Legend, Your Thresholds
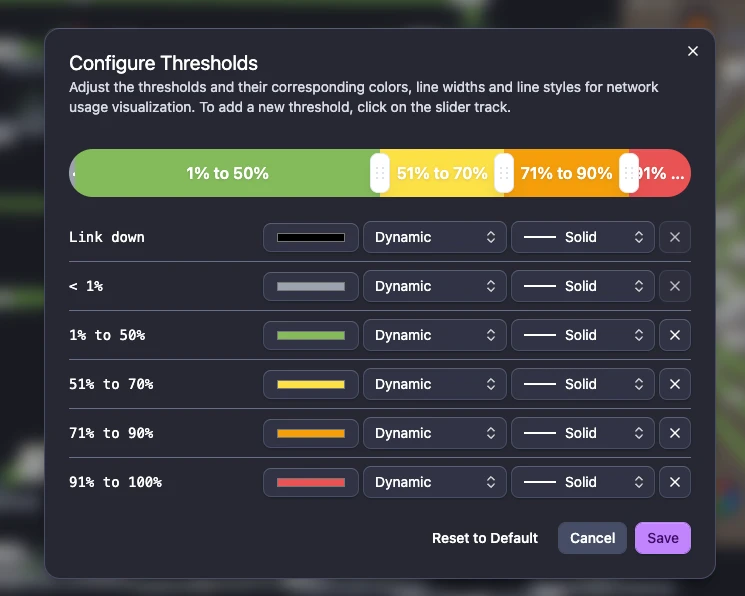
Every map ships with a six-band utilization legend, and every map can change it. Drag the thresholds, click the slider to add a band, and pick the color, line width, and line style for each one. Reset to default any time.
- Link down
- Under 1%
- 1% to 50%
- 51% to 70%
- 71% to 90%
- 91% to 100%
Line width can follow link capacity or be fixed at small, medium, or large; lines can be solid, dashed, or dotted. For microwave hops, GPON uplinks, or rate-limited circuits, set a custom speed on the port or VLAN interface and both the map colors and the utilization alarms use it.
Can I...? YES!
With NetSense Network Topology, the answer is always YES! Here's what you can do with our platform.
Can I replace Weathermap without editing a single config file? YES!
Can I see link utilization colored on the map in real time? YES!
Can I set my own utilization thresholds, colors, and line styles per map? YES!
Can I see which devices have active alarms right on the map? YES!
Can I open a topology view for any OLT or switch without drawing it first? YES!
Can I sync links and circuits from NetBox? YES!
Can I group devices into data centers, POPs, or sites on the map? YES!
Can I put Google, Netflix, Akamai, and other peers on the map with their own icons? YES!
Can I roll back a map and see exactly what changed between versions? YES!
Can I find any device on a map by hostname or IP? YES!
Can I hear an alert on the NOC screen when a link goes down? YES!
Can I set a custom speed for microwave or rate-limited links? YES!
Network Topology FAQ
Common questions about NetSense network maps and dynamic topology.
Retire Your Weathermap
Book a live demo and see a real production map: links colored by utilization, alarms on every node, version diffs, and an on-demand topology view for any OLT or switch.