A BNG is where subscribers become sessions, so it is the first place a mass disconnect shows up. NetSense polls the active subscriber sessions on your BNGs and turns them into three things: charts of the session count over time and per VLAN, a searchable table of every active session, and per-subscriber traffic, both as history and live.
All of it lives on the BNG’s device page: the charts on the Overview tab, the table on the Sessions tab, and the per-VLAN view on the VLANs tab.
Which BNGs report sessions
Sessions are collected only on the BNG device type, and only on the platforms below. What each one reports depends on what the BNG exposes over SNMP.
| Vendor | Models | Connection types | Per-VLAN charts and VLANs tab | Session traffic |
|---|---|---|---|---|
| Huawei | NetEngine BNGs (NE40E, NE8000, NE05E and other NE models) | PPP | Yes | History and live |
| Nokia | 7750 SR | PPP and IPoE | Yes | History only |
| MikroTik | RouterOS | PPP and Hotspot | No | PPP: history and live. Hotspot: live only |
A few columns are vendor-dependent too:
- Speed (the download and upload rate limit of the session) is filled only where the BNG reports it, which today means Huawei.
- IPv6 addresses are collected on Nokia. Each address gets a line of its own, so the WAN address and the delegated prefix both show. Huawei and MikroTik sessions show IPv4 only.
- On MikroTik, every PPP flavor (PPPoE, L2TP, PPTP, SSTP, OpenVPN) is shown as PPP.
Add the device with the BNG device type and the manufacturer and model exactly as listed in supported vendors. A BNG added as a switch, or with another model name, is polled for ports and health but gets no sessions.
Session charts on the Overview
The BNG Sessions section sits on the BNG’s Overview tab, between BNG Performance and BNG Health. It follows the time range you pick at the top of BNG Performance, and dragging across a time chart zooms the page’s charts to that window.
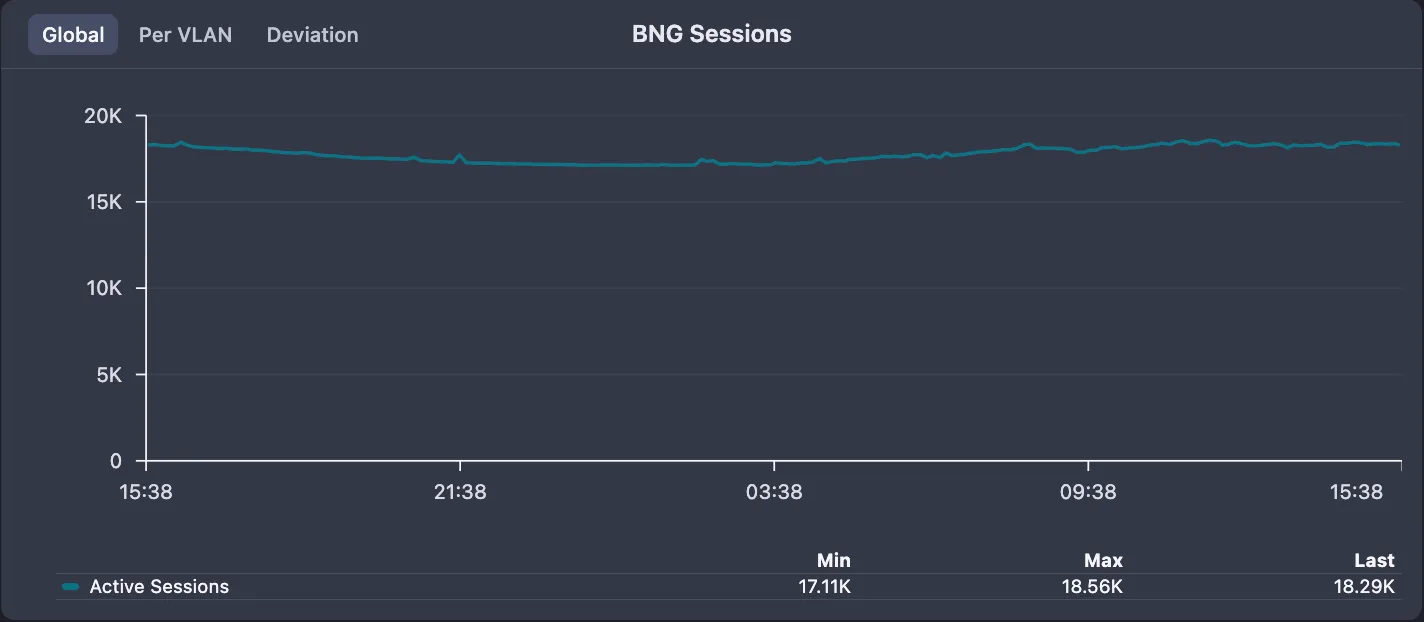
It has three tabs:
- Global: the total number of active sessions over time, with the minimum, maximum and last value in the legend. This is the chart to watch during an incident: a cliff here is subscribers dropping off.
- Per VLAN: a bar per VLAN with its current number of active sessions, busiest first. With many VLANs the chart scrolls sideways rather than squeezing the bars.
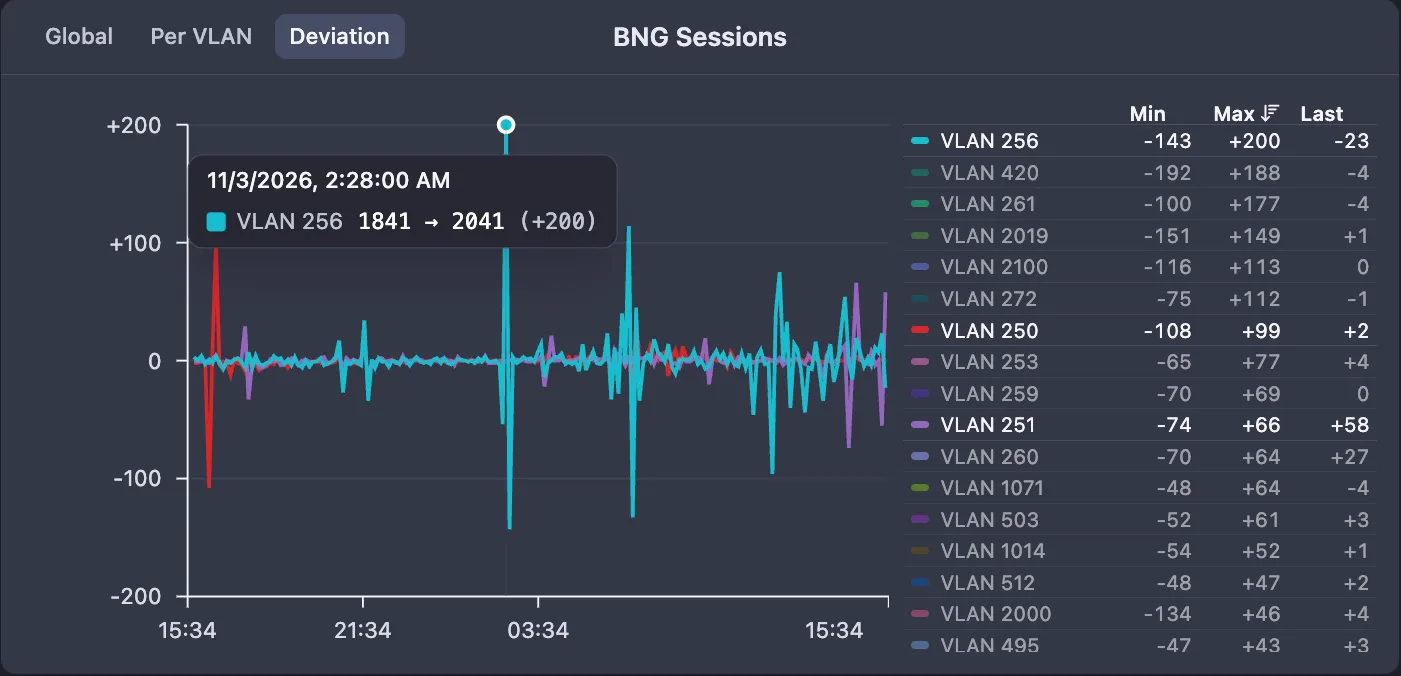
- Deviation: how much each VLAN’s session count went up or down from one sample to the next. A flat line at 0 is a quiet VLAN; a deep negative spike on one VLAN, while the others stay flat, points at the access network behind that VLAN rather than at the BNG.
Per VLAN and Deviation need the BNG to report the VLAN of each session, so they are not shown on MikroTik.
Reading the deviation chart
The deviation chart has one line per VLAN, which gets busy on a BNG with a few hundred VLANs. The legend and the tooltip are built to cut it down:
- Sort the legend. The legend lists every VLAN with its Min, Max and Last change. Click a column header to sort by it: once for highest first, again for lowest first, a third time to return to the original order. Sorting by Min puts the VLANs that lost the most subscribers at the top.
- Isolate VLANs. Click a VLAN in the legend to show only that VLAN. Cmd-click (Ctrl-click on Windows) adds or removes one more. Click the chart background to show all VLANs again. The Y axis rescales to the VLANs on screen, so a small VLAN’s changes are readable once the large ones are hidden.
- The chart refreshes every minute, and a refresh resets the legend sort and shows all VLANs again, so sort and isolate again after it.
- Hover for the nearest VLAN. The tooltip shows only the VLAN line closest to the
pointer, with its session count before and after and the change, for example
1962 → 2039 (+77).
The same click behavior applies to the legend of every time-series chart in NetSense. See reading charts.
The Sessions tab
The Sessions tab lists every active session on the BNG, 50 per page, the most recently started first. Ended sessions drop off the list.
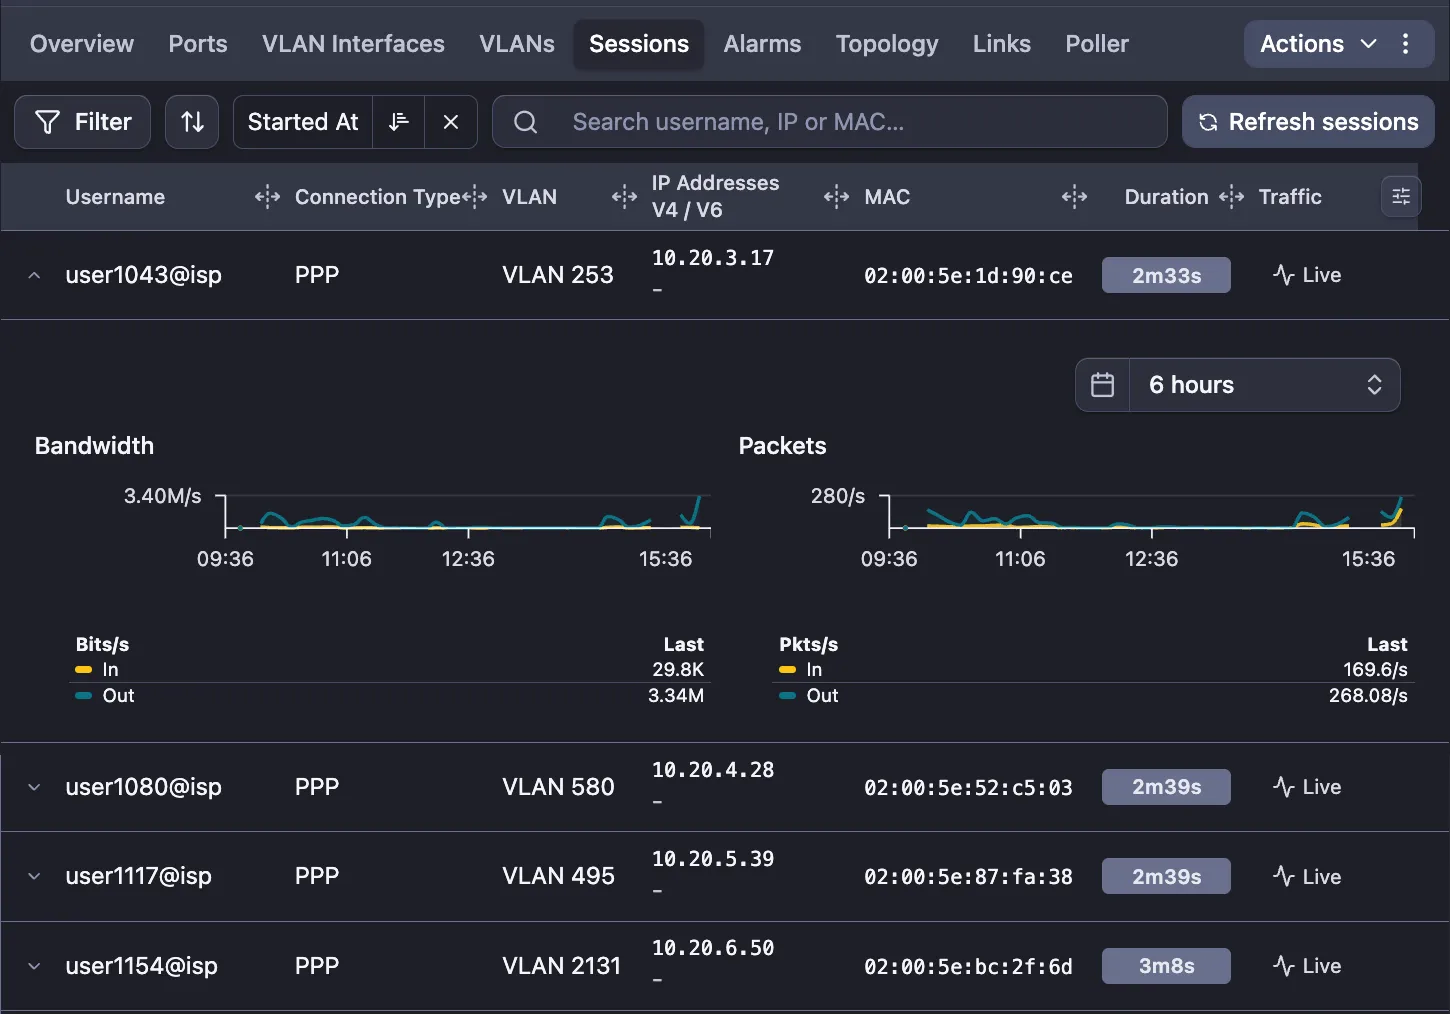
The default columns are:
| Column | What it shows |
|---|---|
| Username | The subscriber name as the BNG reports it (see Usernames) |
| Connection Type | PPP, IPoE or Hotspot |
| VLAN | The VLAN the session arrives on |
| IP Addresses | IPv4 on the first line, IPv6 on the second. Hover a truncated address to see all of it |
| MAC | The subscriber’s MAC address |
| Duration | How long the session has been up, counting live |
| Last Seen | The last poll that saw the session |
| Traffic | The Live button (see Live traffic) |
Speed, Started At and First Seen are hidden unless you add them from the table’s column settings; the table remembers your choice. On a narrow window some of the default columns hide too, starting with MAC and Last Seen.
Finding a subscriber
- The search box (Search username, IP or MAC…) matches any of the three, so a support agent can paste whatever the customer gave them.
- The filter button narrows the list by VLAN or Connection Type. The VLAN list covers every VLAN on the BNG, not only the current page.
- The sort button orders by Username, Started At, First Seen or Last Seen.
- Refresh sessions asks the agent to poll the BNG’s sessions now instead of waiting for the next cycle.
Duration, Started At and First Seen
Duration counts from Started At when the BNG reports a start time for the session, and from First Seen (the first NetSense poll that saw the session) when it does not. Hover the duration to see which one it used. A session that was already up when NetSense first polled the BNG shows a duration from that first poll, so a long-running session can read shorter than it really is.
Session traffic history
Click the arrow at the start of a row to expand it. Two charts show that subscriber’s traffic: Bandwidth in bits per second and Packets per second, with their own time range selector.
History follows the subscriber, not the session ID. It is keyed on the username, or on the MAC address when the BNG reports no username, so the graph carries on through reconnects and new sessions on the same BNG. A session with neither shows “No username or MAC address is available for session history.”
Hotspot sessions have no history and cannot be expanded; use Live for them.
Live traffic
The Live button opens Live Traffic for that one session: in and out traffic streamed from the BNG while the window is open. Polling interval sets how often it samples, from 5s to 30s (default 10s). Use it to watch a subscriber’s speed test while they are on the phone, or to confirm that a complaint of “no traffic” really is no traffic.
The Traffic column and the Live button are not shown on BNGs that cannot stream a single session (Nokia 7750 SR today). History is still available there by expanding the row.
The VLANs tab
The VLANs tab lists the VLANs the BNG carries, with each VLAN’s number, name, description, the ports the device associates with it, its current Active Sessions and Last Updated. Expand a VLAN to see its subscriber sessions over time; click that chart to open it larger.
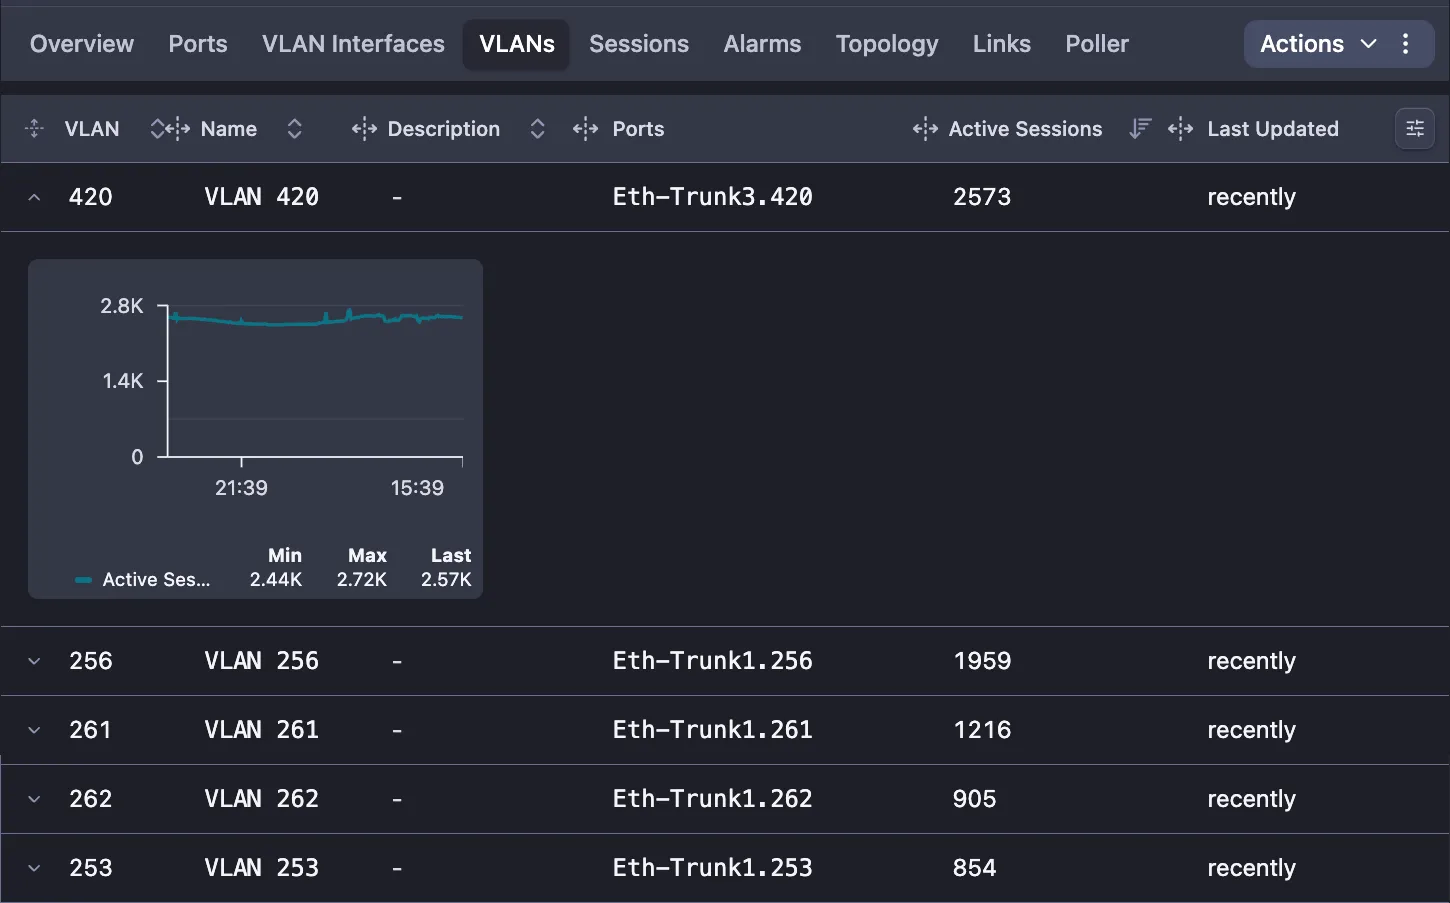
The tab appears only when the BNG reports its VLANs, which today means Nokia 7750 SR and Huawei NetEngine BNGs. A VLAN whose ports NetSense does not poll shows no ports.
The VLAN Interfaces tab is a different view: the routed VLAN interfaces and sub-interfaces with their status, traffic and IP addresses. See ports and interfaces.
What the Username column shows
The username is whatever the BNG reports for the session. NetSense does not look it up anywhere else.
- Nokia 7750 SR. The username comes from the subscriber identification string. If the BNG builds that string from the MAC address, which happens when RADIUS returns no subscriber ID, the Username column shows a MAC. That is a BNG configuration choice: have RADIUS return the PPPoE username as the subscriber ID, or set up a subscriber identification policy that uses it. On IPoE sessions where the identification string is only a MAC, the Username column stays empty and the MAC column carries it.
- MikroTik Hotspot. Hotspot sessions are identified by the client MAC, which appears as the username.
- Huawei. The username of the authenticated PPPoE subscriber.
Permissions
bng:session:viewshows the Sessions tab, the BNG Sessions charts and the Active Sessions column of the VLANs tab.bng:port:viewis needed for the VLANs and VLAN Interfaces tabs.
See users, roles and partner access for assigning them.
Limits
- Sessions are polled, not streamed. A session that starts and ends between two polls is never seen, and a session that just ended stays on the list until the next poll.
- History follows a username or MAC on one BNG. A subscriber who moves to another BNG starts a new history there.
- If the tab shows “Session storage is not configured”, session storage is switched off on your NetSense installation. That is a setup issue, not an empty BNG: contact Extreme Labs support.