The time-series charts in NetSense, on device, port, ONU, BNG and agent pages, share the same controls. This page lists them once, so the other guides don’t have to.
Picking series from the legend
- Click a legend entry to show only that series. Click it again to bring all series back.
- Cmd-click (Mac) or Ctrl-click (Windows, Linux) adds a series to the view or removes it, one at a time.
- Click an empty part of the chart to show all series again.
- The Y axis rescales to the series still shown, so a small series hidden under a large one becomes readable. Charts on a fixed scale, such as CPU, memory and disk in percent, keep it.
- On charts with thresholds, such as optical power, the Min Threshold and Max Threshold entries switch the threshold lines on and off.
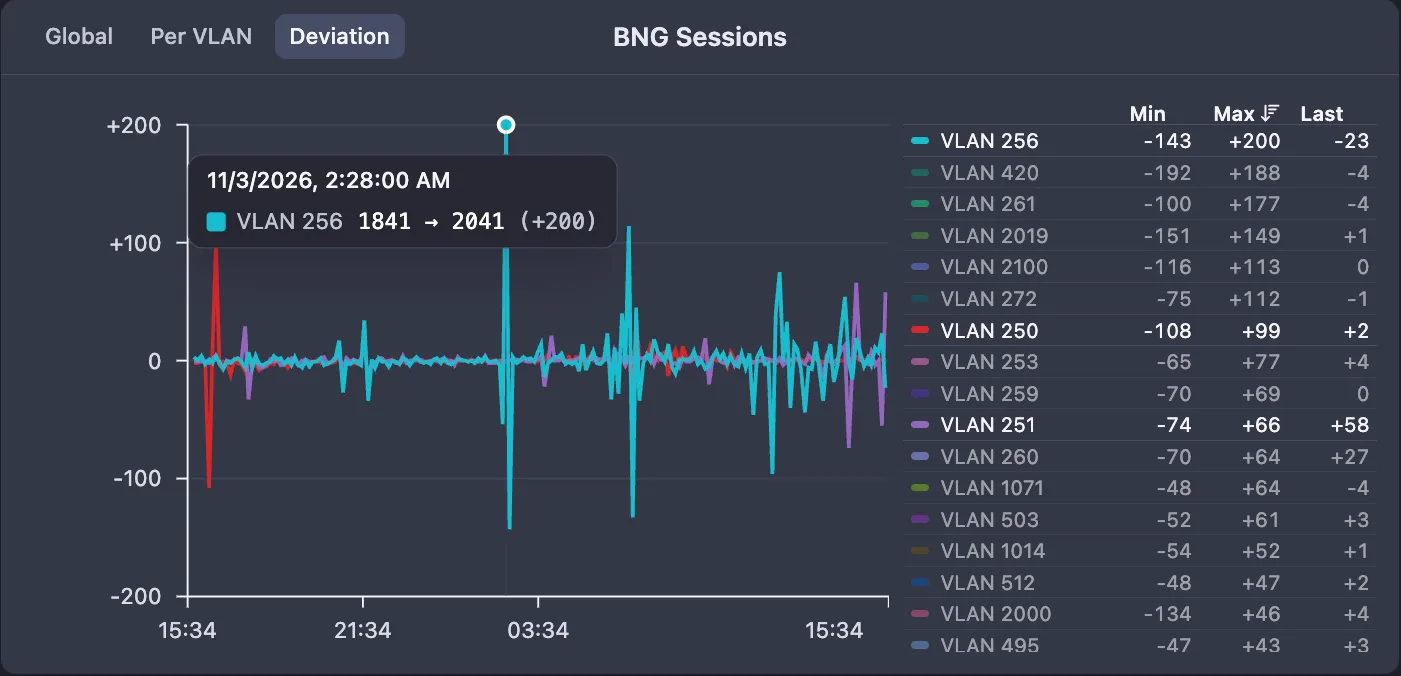
Legend values
Some charts show a table under or beside the chart instead of a plain legend, with a value per series for the selected period: Min, Max, Last, or a percentile such as P95, depending on the chart. On the BNG Sessions deviation chart the Min, Max and Last headers sort the list: click once for descending, again for ascending, a third time for the original order.
Tooltips
Hover a chart to read the values at that moment. The BNG Sessions deviation chart, which can carry many VLANs, shows only the VLAN nearest the pointer, with a dot on its line.
Where a device or port chart has a hole because the device was down or in Warning, or the port was down or disabled, the period is shaded: red for a down device, amber for Warning, and a pattern for ports. Hover the shading to see why. The shading is drawn for ranges of up to 30 days.
Time range and zoom
The time range picker has two parts. The list offers Last 5 minutes, Last 30 minutes, Last 1 hour, Last 3 hours, Last 6 hours, Last 12 hours, Last 24 hours, Last 2 days, Last 7 days and Last 30 days. Where a chart keeps less history, the longer presets are left out. The calendar button sets a custom From and To.
On most device and port charts you can also drag across the chart to zoom into that period. Reset zoom next to the time range picker returns to the range you had before. Many charts open in a larger view when you click them.
On device and port charts, longer ranges show averaged points: one per minute up to 24 hours, one per 5 minutes up to 7 days, one per 6 hours up to 30 days and one per day beyond. When the range reaches into older, averaged data, a Min/Max switch appears on device charts. It is on by default and shades the lowest and highest readings around each averaged point, so short peaks don’t disappear in the average.
Auto-refresh
Port pages, the Ports tab of switches, BNGs, servers and wireless devices, and a few other tables such as VLAN Interfaces have a refresh button. Click it to reload now, or open the arrow next to it and pick an interval: Off, 1 minute, 3 minutes, 5 minutes, 15 minutes or 30 minutes. Auto-refresh is Off by default. Your choice is remembered in your browser for that kind of page.
Traffic rates
Traffic rates are shown with three significant digits, for example 475 Mbps, 47.3 Mbps and 3.62 Gbps. A value that rounds to 1000 moves up a unit: 999.6 Mbps is shown as 1.00 Gbps. For the port-specific charts, see Ports and interfaces.