A device can be up, answering ping and passing traffic while it is quietly losing redundancy: one of two power supplies dead, a fan stopped, polls timing out half the time. This guide covers where NetSense shows that, which devices report it, and how to get an alarm before the second component goes.
The Health panel
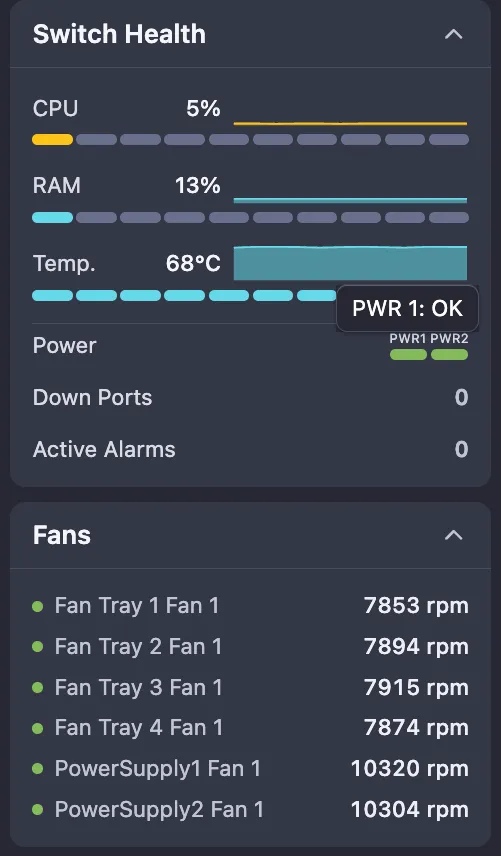
Every device page opens on Overview. The right-hand column starts with a health panel named after the device type: Switch Health, BNG Health, OLT Health and so on. It shows:
- CPU, RAM and Temp. with a 3-hour spark each. Servers show Phys. Mem. instead of RAM.
- Power: one small bar per power supply, labeled PWR1, PWR2 and so on, when the device reports its power supplies (see below).
- Down Ports (and on OLTs Down PON Ports and Down ONUs) and Active Alarms.
The right-hand column is hidden on narrow windows. If you do not see it, widen the browser window or zoom out.
Power supplies
Each PWR bar is one power supply. Hover it for its state:
| Bar | Tooltip | Meaning |
|---|---|---|
| Green | OK | The power supply is working. |
| Red, pulsing | Offline | The power supply failed or lost its feed. |
| Gray | Not Inserted or Not Present | The slot is empty, or the device reports the slot without a unit. |
A red bar on a device with redundant supplies is the one to act on: the device still runs, but the next failure takes it down. It also matters during an outage. A device that goes down with one supply already offline points to a power problem at the site rather than a fiber cut.
Most devices report their supplies as working or failed and nothing in between. On MikroTik, a supply that is installed but unplugged reads the same as a failed one.
PSU status is part of the device-level readings in alarm rules (Switch, BNG and OLT report types). See Creating alarm definitions.
Fans
On switches and BNGs, the Overview has a Fans section under the health panel, listing every fan the device reports with its name and speed:
- Speed is shown in rpm or as a percentage, depending on the vendor. Huawei reports a percentage of full speed; most other vendors report rpm.
- Vendors that report only a status show Online or Offline without a speed.
- A fan that is online but not spinning (speed 0) is shown in amber.
- An offline fan is shown in red, and the number of offline fans appears as a red badge on the Fans header, so it is visible even with the section folded.
- Empty fan slots are folded into one line, for example “3 empty slots”. Hover it to see which slots are empty.
The section appears only when the device reports at least one fan. Fanless hardware, such as the smaller MikroTik CRS switches, has no Fans section.
Alerting on a fan
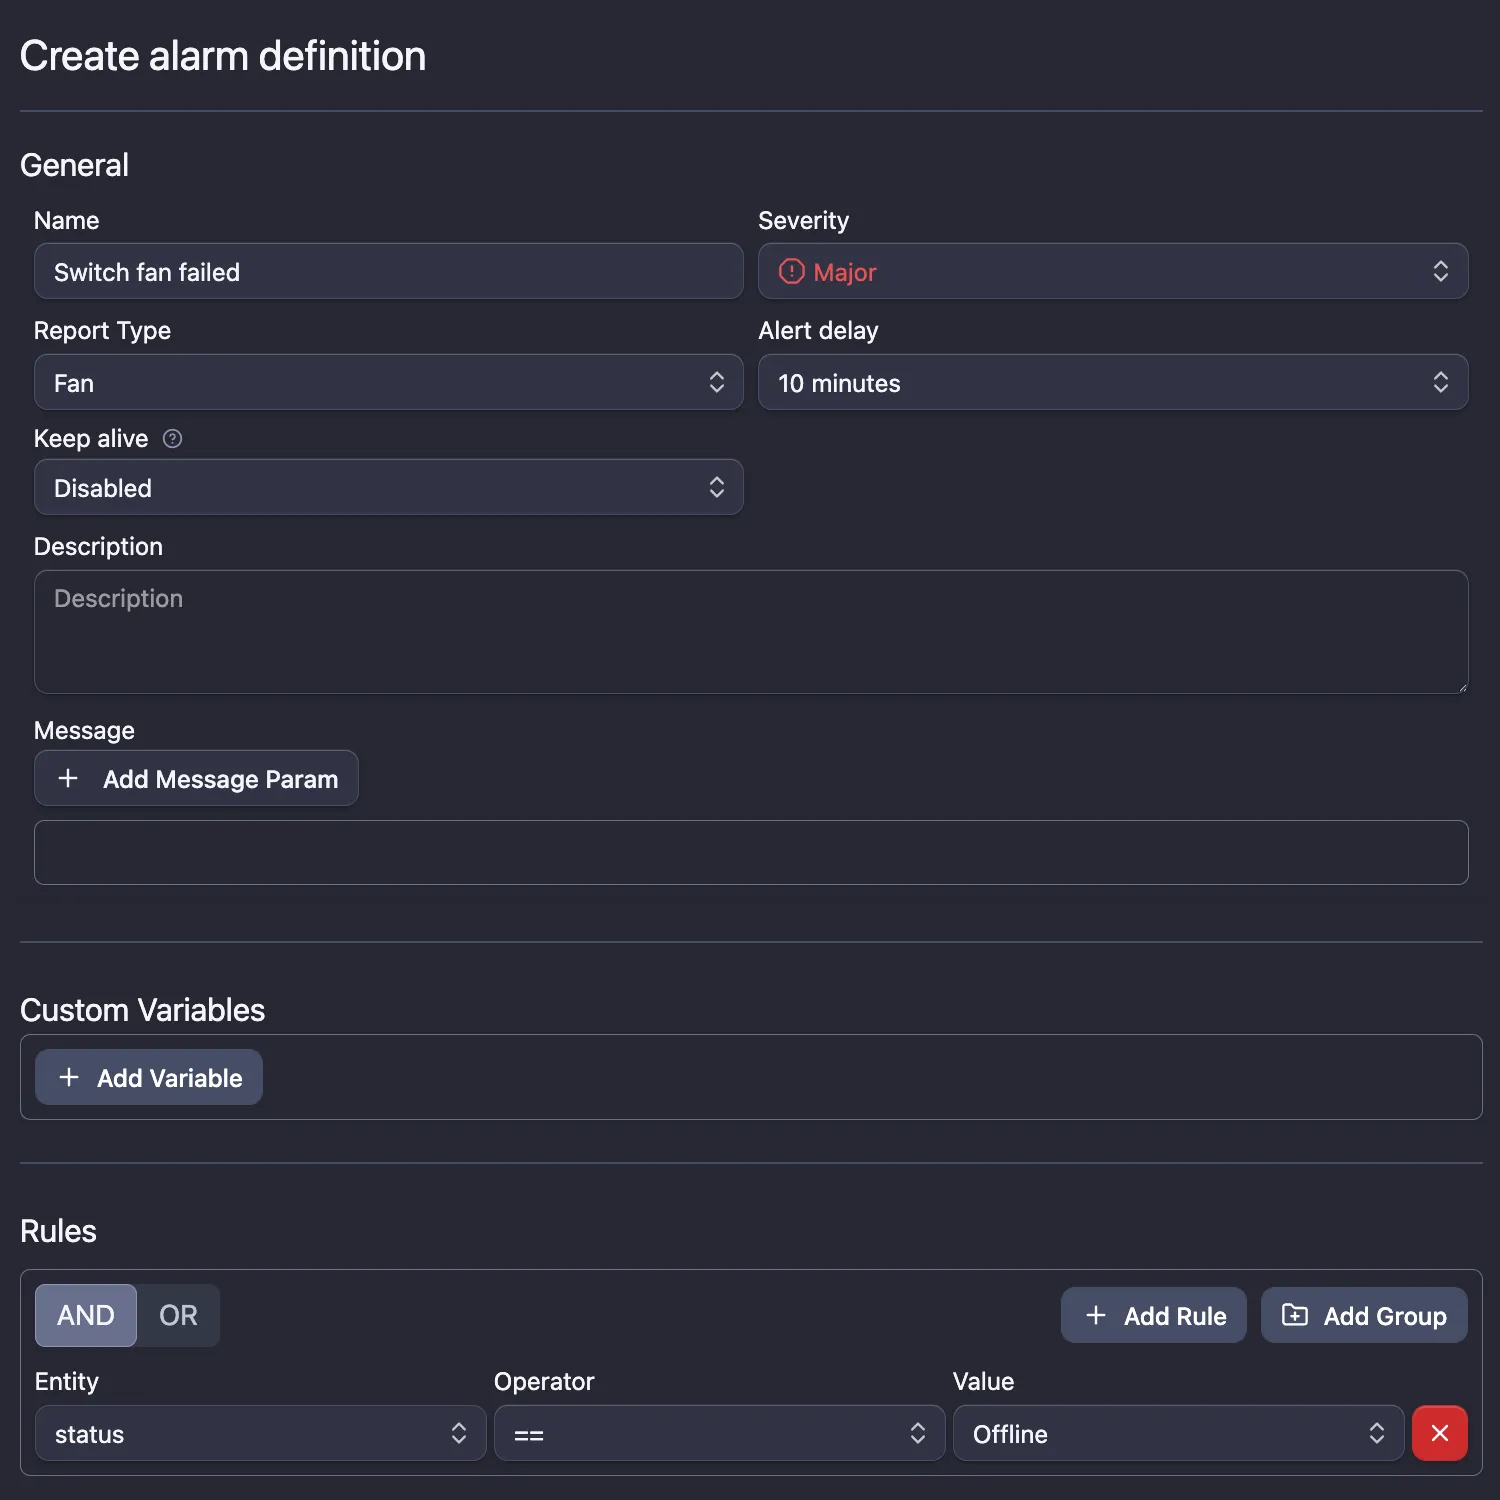
NetSense does not create a fan alarm for you. Add one under Alarms → Alarm Definitions
with the report type Fan (it needs alarm:rule:edit, and switch:view or bng:view
to pick the type). The rule fields are the fan’s status, speed, slot and name, the
hostname, and the device’s manufacturer, model and versions.
Each fan raises its own alarm, named after the fan. A second failed fan on the same device opens a second alarm instead of hiding behind the first.
Two rules that work well:
Fan failed (Major, alert delay 10 minutes):
    status  =  Offline

Fan running hot (Warning, alert delay 30 minutes, Huawei only):
    manufacturer  =  Huawei
    speed         >= 80
Speed is a percentage on Huawei and rpm elsewhere, and the rule cannot tell the two apart.
Always scope a speed rule by manufacturer or model. A message such as
Fan {{Name}} on {{Hostname}} ({{Model}}): speed {{Speed}} tells the on-call engineer
which tray to look at.
Step-by-step definition building, delays and relays are covered in Creating alarm definitions and Alarm timing.
Which devices report power supplies and fans
Power supply status is collected on switches and BNGs since release 1.74 and fans since 1.77. Both come from these switch and router families:
- Huawei (VRP switches, CloudEngine, NetEngine) and FutureMatrix
- Cisco IOS and IOS-XE, NX-OS, and SG350
- Juniper
- Nokia 7250 and 7750
- Arista
- Edgecore
- Dell
- Raisecom
- MikroTik
- D-Link DGS-1510
- Optilink MEN99216B
- SONiC
What a given device shows still depends on its model and firmware:
- Models with a single fixed power supply often report no supply at all, so no Power row appears. On MikroTik only chassis with two power supplies report them.
- Some older Huawei VRP firmware does not report power supplies.
- Fanless models have no Fans section.
If a model in this list shows nothing after a few polls, tell Extreme Labs support the model and firmware version. Vendors and models are listed in Supported vendors.
On OLTs, the Power row appears where the OLT integration reads its power supplies. OLTs have no Fans section.
The Poller tab: how well a device answers
Every OLT, switch, BNG, server and wireless device page has a Poller tab. It shows how long each SNMP poll of this device took and whether it completed, compared with the average for the same model.
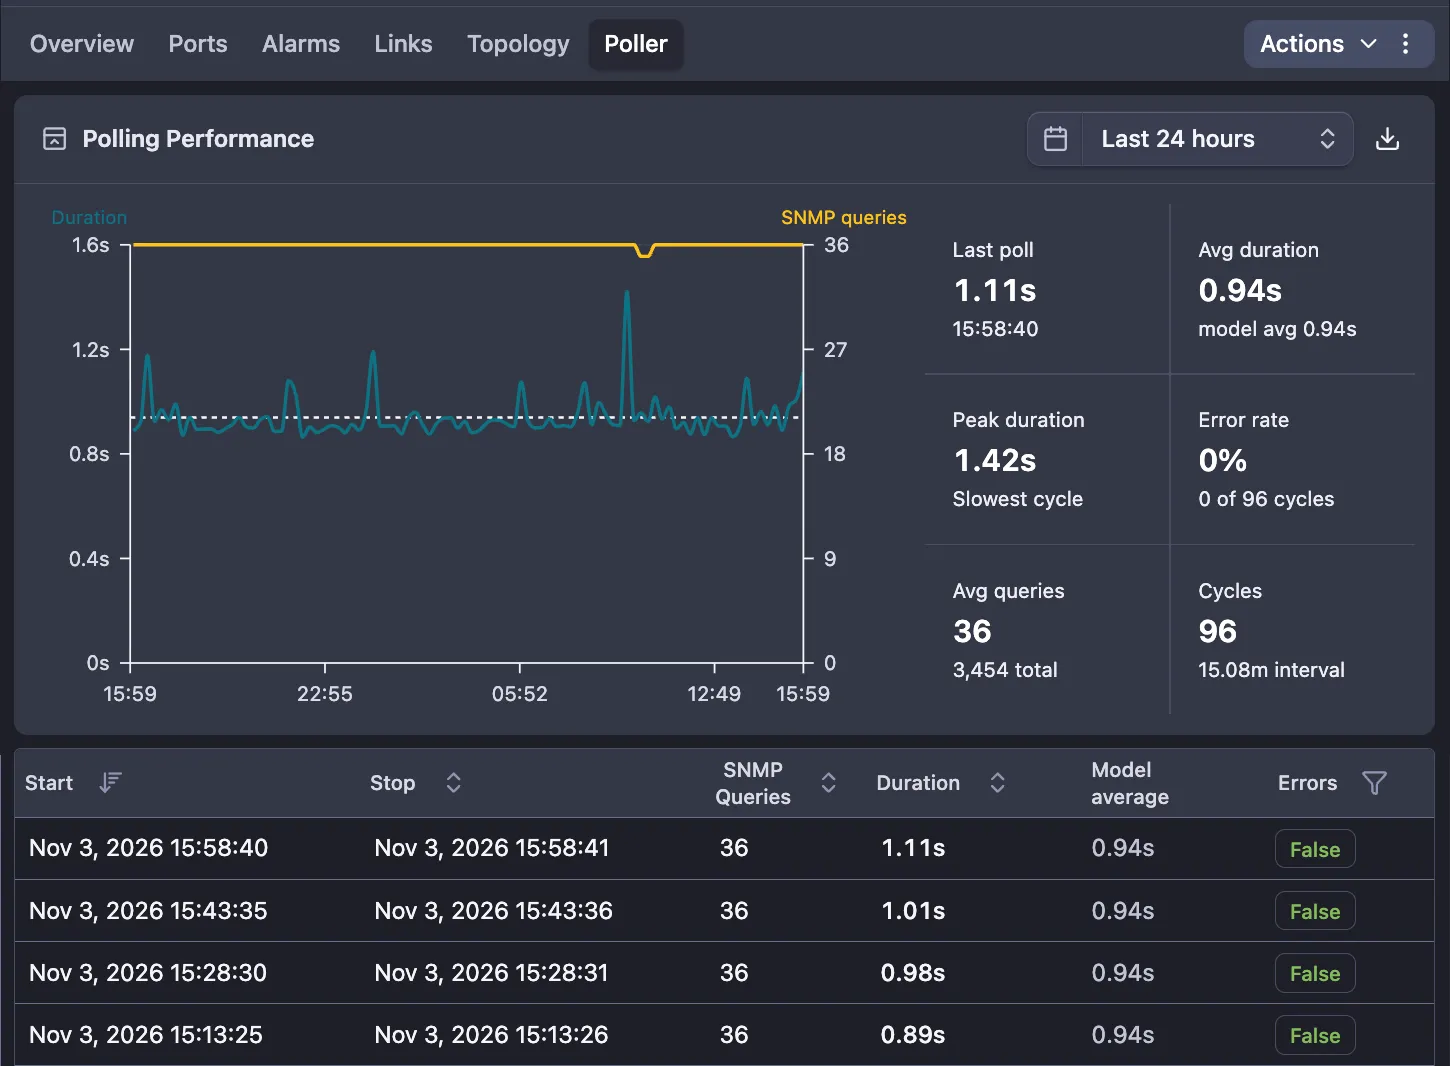
The Polling Performance panel starts collapsed: click its header to open it. It has a chart of Duration (s) and SNMP queries per poll, with errors marked and the Model avg drawn as a dashed line, plus summary boxes:
| Box | What it tells you |
|---|---|
| Last poll | Duration of the latest poll and when it ran. |
| Avg duration | Average over the range, with the model average under it. |
| Peak duration | The slowest poll. |
| Error rate | Share of polls that failed, with the count, plus the number of partial polls when there are any. |
| Avg queries | SNMP queries per poll. |
| Cycles | Number of polls and the average interval between them. |
The table below lists every poll with Start, Stop, SNMP Queries, Duration, Model average and Errors:
- False (green): the poll completed.
- Partial (amber): some SNMP requests in the poll timed out. Port alarms do not close or reopen on a partial poll; they wait for the next complete one.
- True (red): the poll failed.
Filter the Errors column by Error, Partial or No error. The range picker goes back up to the last 30 days, and the download button exports every poll in the range as CSV.
How to read it. A device that is consistently several times slower than its model average, or that has many partial polls, is slow to answer SNMP. That is a management-plane problem: the device usually still forwards traffic, but its data in NetSense arrives late or incomplete. OLTs with many ONUs are slower to poll by nature. Typical causes are a busy device CPU, rate limits on SNMP or ARP on the device, or a congested path to the polling agent. If one agent’s devices all slow down together, see Running several polling agents.
The Insights tab on OLTs
OLT pages have an Insights tab (it needs onu:view). Its first and only insight today is
Flapping ONUs: ONUs that keep changing state, which usually points at a fiber, connector
or splitter fault.
- Two counters: Last 3 min and Last 24 hours. Click one to list its ONUs below.
- An ONU counts as flapping from 5 cycles (the Flapping count threshold badge).
- The table shows Cycles, status, PON port, ONU index, SN / MAC and Description. Click the serial to open the ONU.
The two windows are counted differently. The 3-minute window uses the live flap counter, where one down-and-up pair is a cycle; the 24-hour window counts stored down events. Compare ONUs within one window, not across the two. Switch pages have no Insights tab.
For more on ONU states and down reasons, see Monitoring ONUs.
Server details
Servers report more about themselves than network devices. On a Linux server:
- Device Information on the Overview adds OS, Architecture and Last Reboot.
- The CPU tab lists each core by name with its Utilization and a 3-hour trend.
- The Memory tab lists physical, virtual and swap memory with usage, used and free.
- The Storage tab lists each disk or volume with Usage, Used / Total and Free.
- The Disk I/O tab lists each disk with Reads and Writes per second.
Tabs appear only when the server reports that data. Server alarm rules can use the same readings, see Creating alarm definitions.