Routers and switches can measure a path themselves: ping a target every few seconds and keep the loss and round-trip time. Cisco calls these IP SLA operations, Huawei calls them NQA tests and Juniper calls them RPM probes. NetSense collects their results, so the path from your POP to a transit, an IXP or a data center shows up next to the rest of your monitoring.
NetSense reads the probes; it does not create them. You configure each probe on the device, as you do today, and NetSense picks it up.
What the device needs
-
The vendor. Probes are read on devices whose manufacturer in NetSense is Cisco, Huawei or Juniper. Check the manufacturer in Inventory: a device added under a different manufacturer name is not checked for probes.
-
A switch device. The IP SLAs tab is on the switch device page, so add routers as switches. BNG pages have no IP SLAs tab.
-
ICMP echo probes. NetSense collects ping probes:
- Cisco: IP SLA
icmp-echooperations - Huawei: NQA tests of type ICMP
- Juniper: RPM probes of type ICMP ping
Other probe types, such as UDP echo, TCP connect, HTTP or DNS, are not collected. Ask Extreme Labs if you need one.
- Cisco: IP SLA
-
A running probe. The probe must be scheduled and running on the device. A probe that is configured but never started has no results to read.
-
SNMP access to the probe tables. NetSense reads the results over SNMP with the device’s existing credentials. If your SNMP configuration limits what NetSense can see (an SNMP view on Huawei, for example), include the probe MIB:
CISCO-RTTMON-MIB(1.3.6.1.4.1.9.9.42) on Cisco, the Huawei NQA MIB (1.3.6.1.4.1.2011.5.25.111) andDISMAN-PING-MIB(1.3.6.1.2.1.80) on Juniper.
Timing. NetSense looks for probes on each device every 6 hours, so a probe you add today can take up to 6 hours to appear. Once it is found, its results are read on an interval Extreme Labs sets, between 30 seconds and 1 hour. Probe history is kept for 90 days.
Seeing probes needs both sla:view and switch:view.
The IP SLAs list
Switches → IP SLAs lists every probe in the tenant, one row per probe.
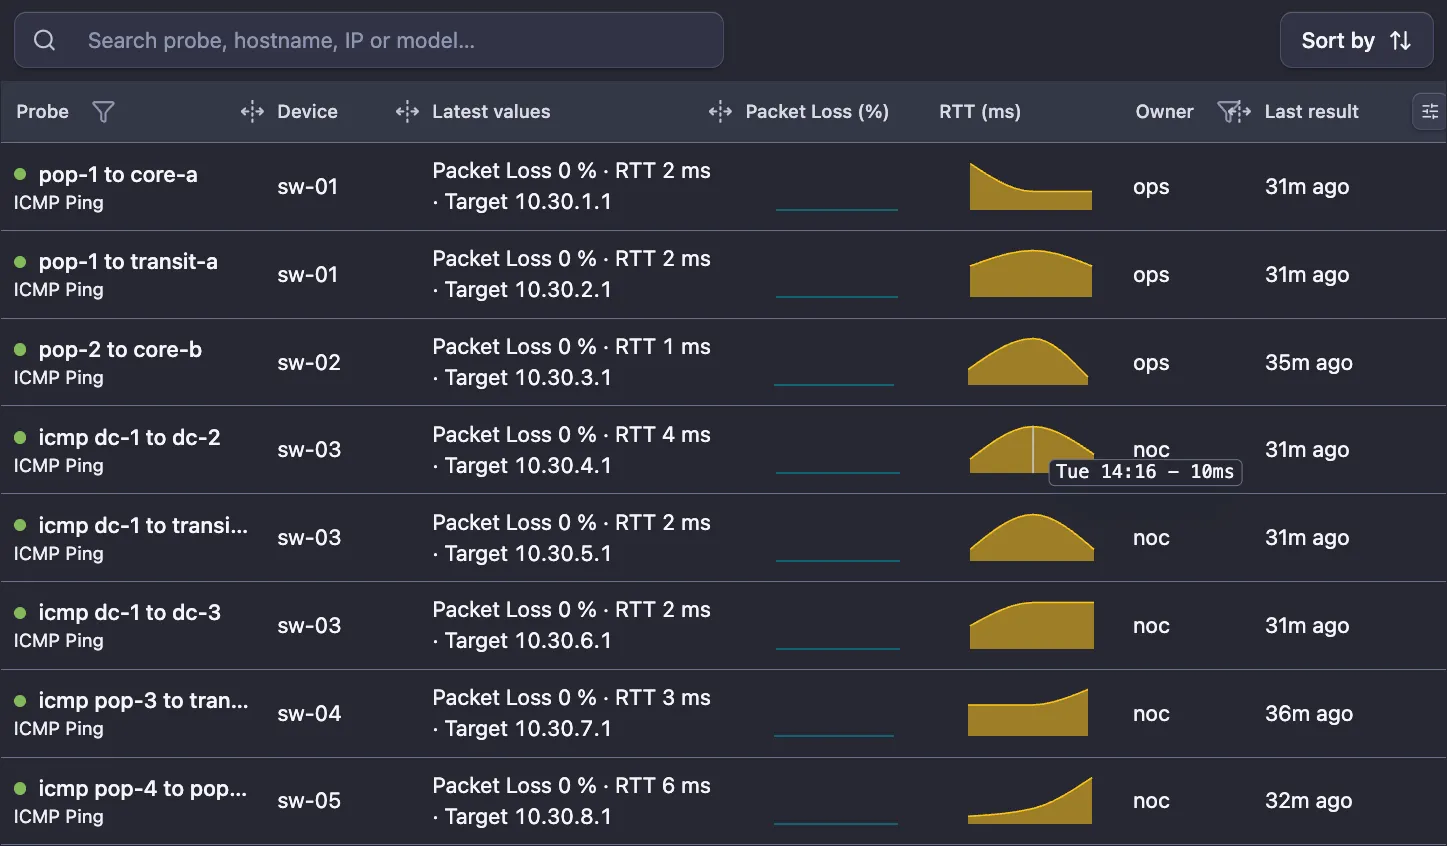
| Column | What it shows |
|---|---|
| Probe | A status dot, the probe’s description as configured on the device, and the probe type under it (for example ICMP Ping). |
| Device | The device that runs the probe. Click it to open the device. |
| Latest values | The last result, for example “Packet Loss 0 % · RTT 2 ms · Target IP”. |
| Packet Loss (%) | A sparkline of packet loss over the last 3 hours. |
| RTT (ms) | A sparkline of round-trip time over the last 3 hours. |
| Owner | The probe owner as configured on the device. |
| Sense | The outcome of the last test as the device reports it, for example success. |
| Last result | When the device last completed the probe. “never” means no result has been collected yet. |
| Tracking | Active, or Removed when the probe is no longer configured on the device. The history of a removed probe is kept. |
The status dot reads OK (green), Warning (amber), Critical (red) or Unknown (violet, no usable result). Hover the probe for its status and full description. The status comes from the probe result, as mapped by the probe definition that Extreme Labs maintains.
Search covers the probe, hostname, IP address and model. Filters sit in the column headers: status on Probe, and Owner, Sense and Tracking. The owner and sense filters show how many probes each value has. Sort by orders the list by Device or Last result. The list loads more probes as you scroll.
Some columns are shown by default only on wide screens. Use the column menu at the right end of the header row to show them on a smaller one.
The device IP SLAs tab
A switch that runs at least one collected probe gets an IP SLAs tab. It lists the device’s probes with Status, Description, Latest values, Owner, Sense, Last result and Tracking (some of them hidden by default), worst status first.
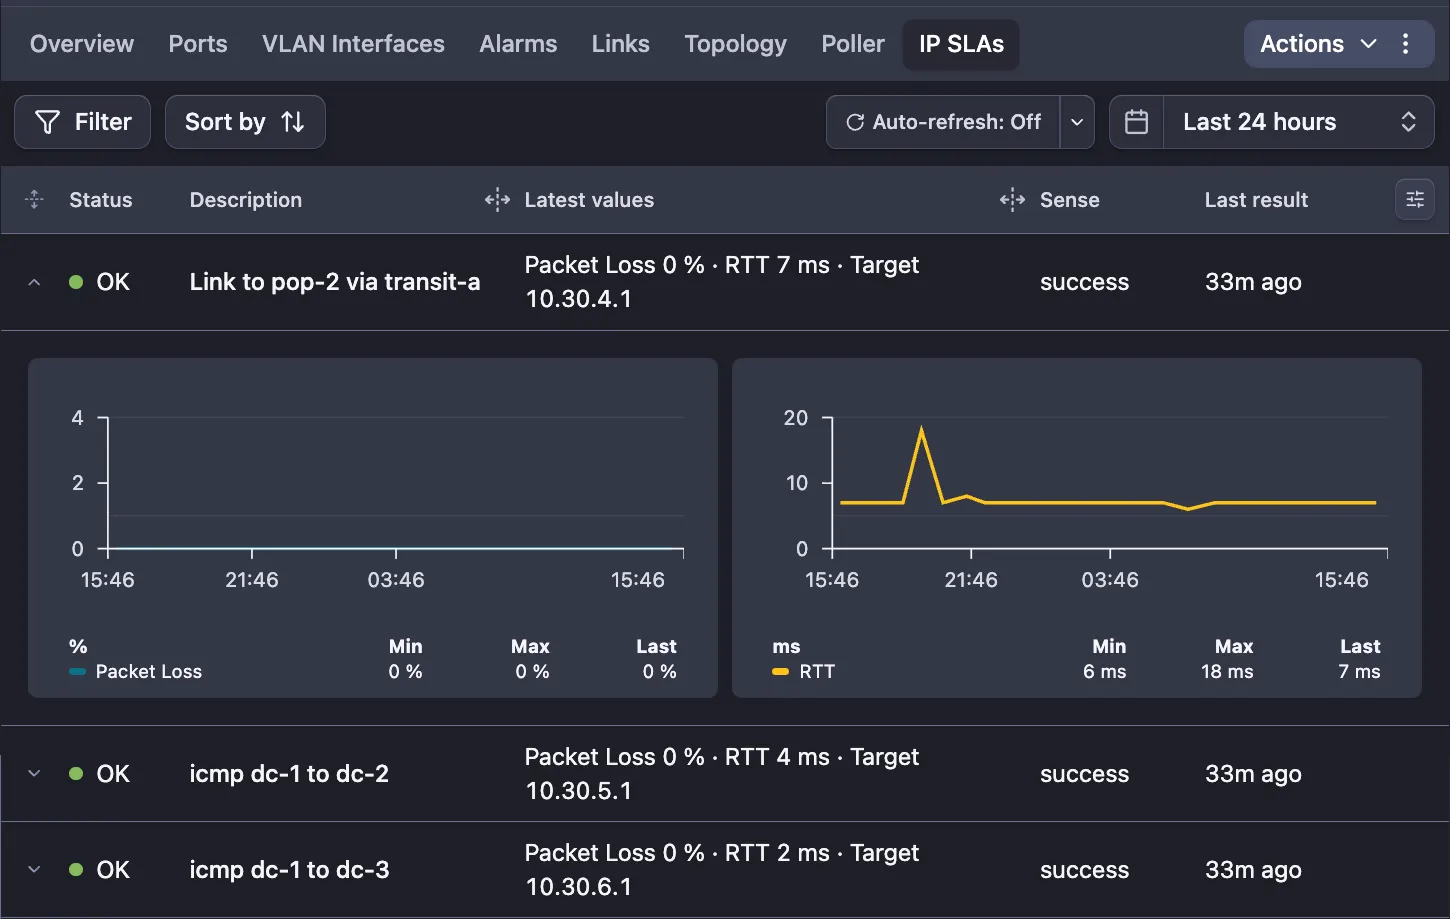
Expand a probe to see its history: one chart per value the probe reports, such as packet loss and RTT. Pick the range from Last 1 hour to Last 90 days, or a custom range within the last 90 days. Click a chart to open it larger. The refresh button updates the probes now, and its menu sets an auto-refresh interval.
The toolbar filters by Status, Sense, Owner and Tracking and sorts by Status, Description, Owner or Last result.
When a probe does not show up
Work through the list in What the device needs: the manufacturer name, the device type, the probe type, whether the probe is running, the SNMP view, and the 6-hour discovery cycle.
Devices also have an IP SLA Capabilities tab that shows how many probes are configured on the device, how many of them are active, and why nothing is collected. It is visible to Extreme Labs administrators only. If a probe is still missing, ask Extreme Labs support to check it for you, with the device name and the probe’s name on the device.
Two more things are set by Extreme Labs for your tenant, not on a screen you can reach:
- The probe definitions: which probe types are collected, how often, and what counts as Warning or Critical.
- Response filters: a filter that limits collection to probes that are actually running. With a filter set, disabled probes produce no samples and no missing-result errors. If stopped probes clutter your list, ask Extreme Labs.
Alarms on probes
Probe results can raise alarms like any other reading. Each probe raises its own alarm.
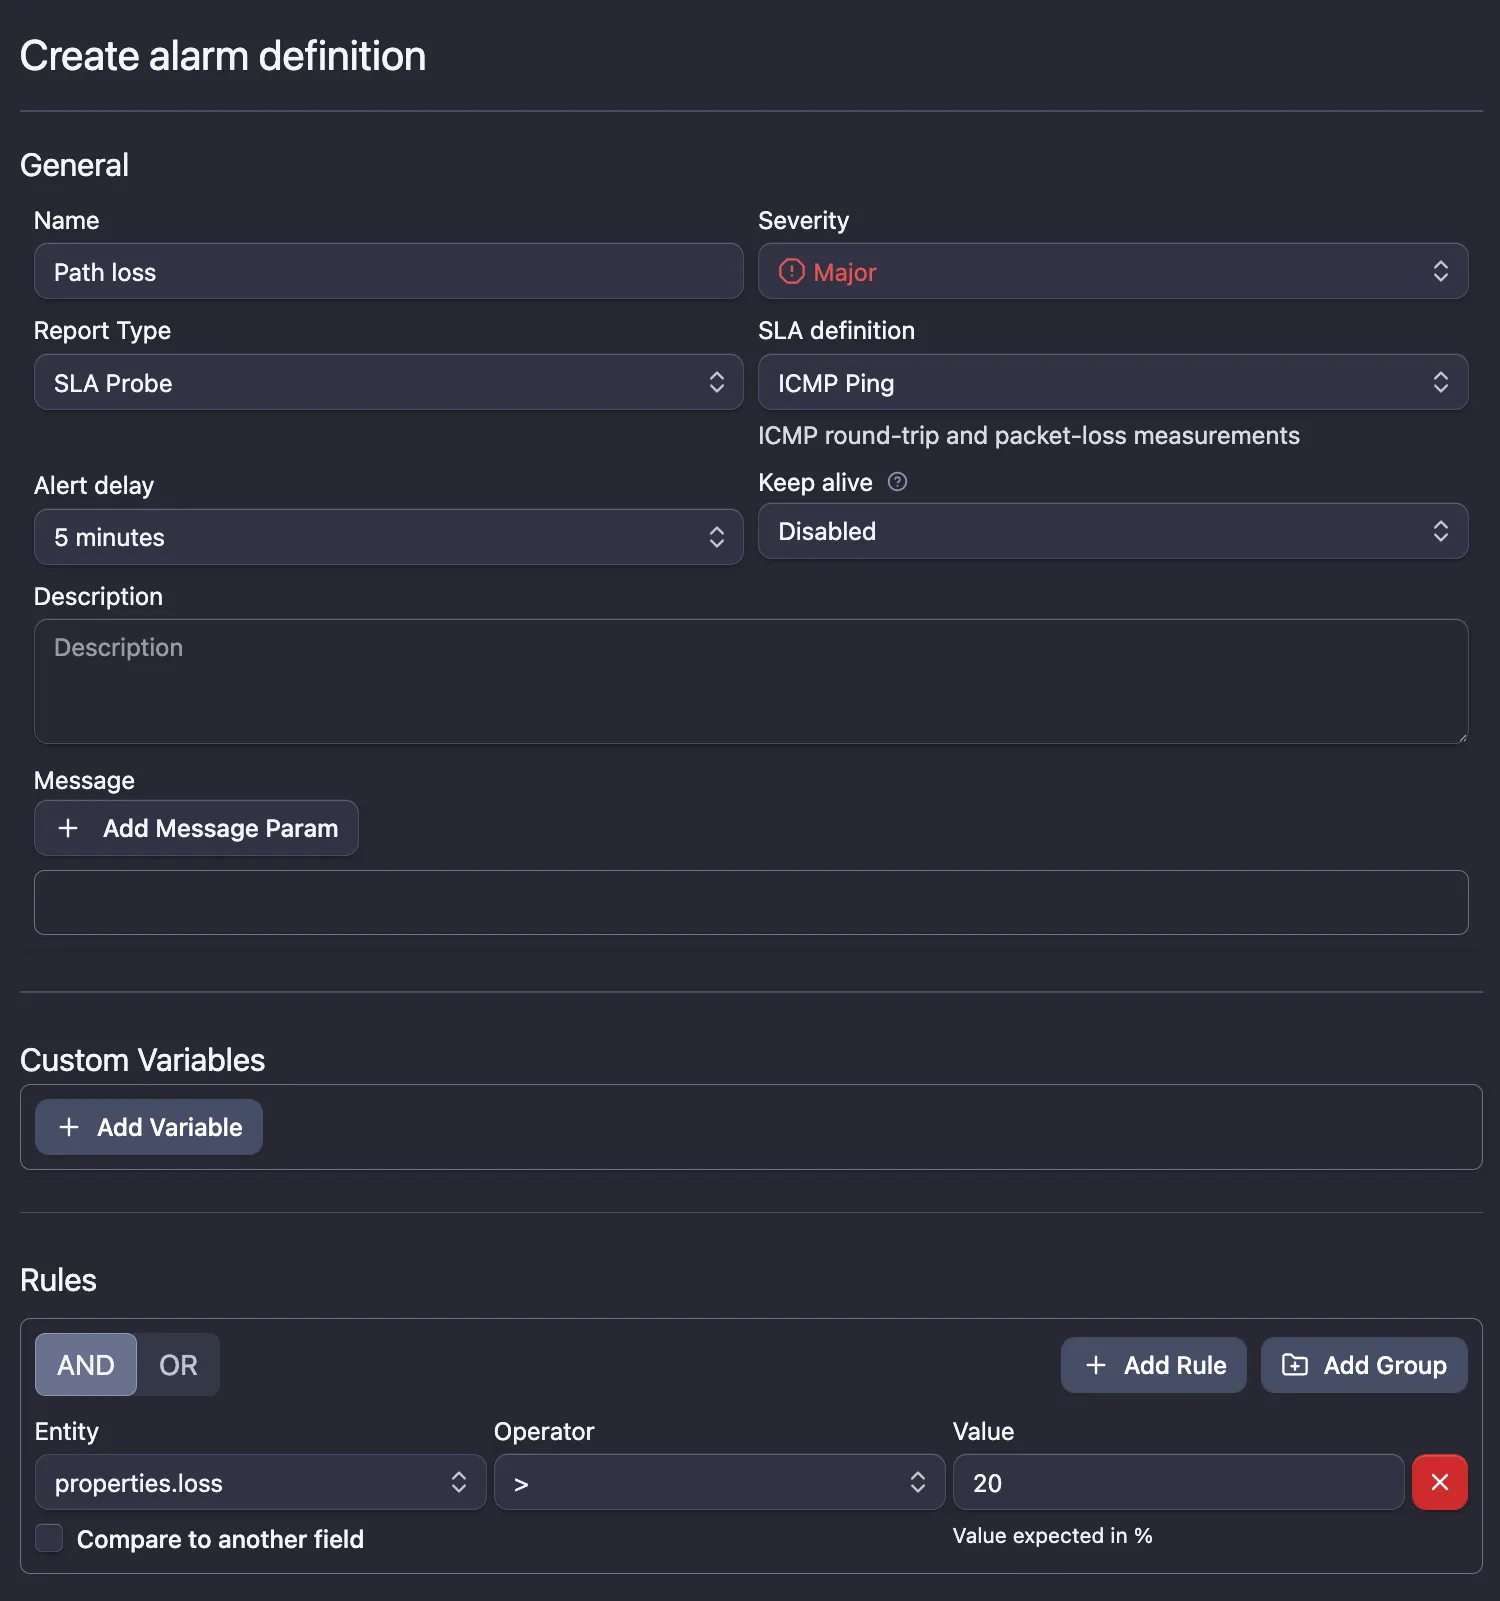
- Open Alarms → Alarm Definitions and add a definition.
- Choose the report type SLA Probe. You need
sla:viewto see it, andalarm:rule:editto save. - Pick the SLA definition the alarm watches, for example ICMP Ping. If the field says No active SLA definitions, no probe type is active for your tenant yet: ask Extreme Labs.
- Build the rule from the fields of that definition. The rule builder shows them by their
raw names, for example
properties.loss(packet loss),properties.rtt(round-trip time) andproperties.target, and offers only the fields the chosen definition reports. - Set the severity, an alert delay and the message, then save and attach a relay.
Path loss (Major, alert delay 5 minutes):
    packet loss  >  20
Changing the SLA definition later clears the rule and custom variables, because they are built from that definition’s fields. NetSense asks before it does.
See Creating alarm definitions for rules, delays and messages, and Handling alarms for acknowledging and suppressing them.
Ping jitter on device charts
Separate from IP SLA probes, NetSense pings every device from its polling agent. The performance chart on each device’s Overview (for example Switch Performance) has Latency, Loss and Jitter tabs for that ping. Jitter is filled only where the agent collects it; on other agents the tab stays empty. Ask Extreme Labs if you need jitter for your devices.
These charts measure the path from the NetSense agent to the device. An IP SLA probe measures the path from the device to its target. Use both: the first tells you whether NetSense can reach the device, the second whether the device can reach where your traffic goes. How to read and zoom the charts is covered in Reading charts.