The Flows module shows the traffic records your routers, BNGs and other exporters send to NetSense. Flows summarizes them: which autonomous systems your traffic goes to and comes from, which destinations and ports carry it, and how it changes over time. Flow Logs lists the individual sessions, with their addresses, ports, interfaces and volumes, and can export them to a file.
Before you start
The module is switched on per tenant by Extreme Labs, together with your own AS number and name, which anchor every view: inbound means traffic entering your AS, outbound means traffic leaving it. The flow collector and the exporters that feed it are set up with our team. If Flows is missing from the sidebar, or the page says “Flows are not enabled”, ask Extreme Labs.
Two role permissions apply (see Users, roles and partner access):
| Permission | What it allows |
|---|---|
flows:view (Flows View) |
The Flows and Flow Logs pages |
flows:export (Flows Export) |
The Export button on Flow Logs and the export page. Requires Flows View |
The built-in roles that include Flows View also include Flows Export. Export also needs the export service to be enabled on your installation. If you hold the permission and still see “Export unavailable”, ask Extreme Labs.
Flows
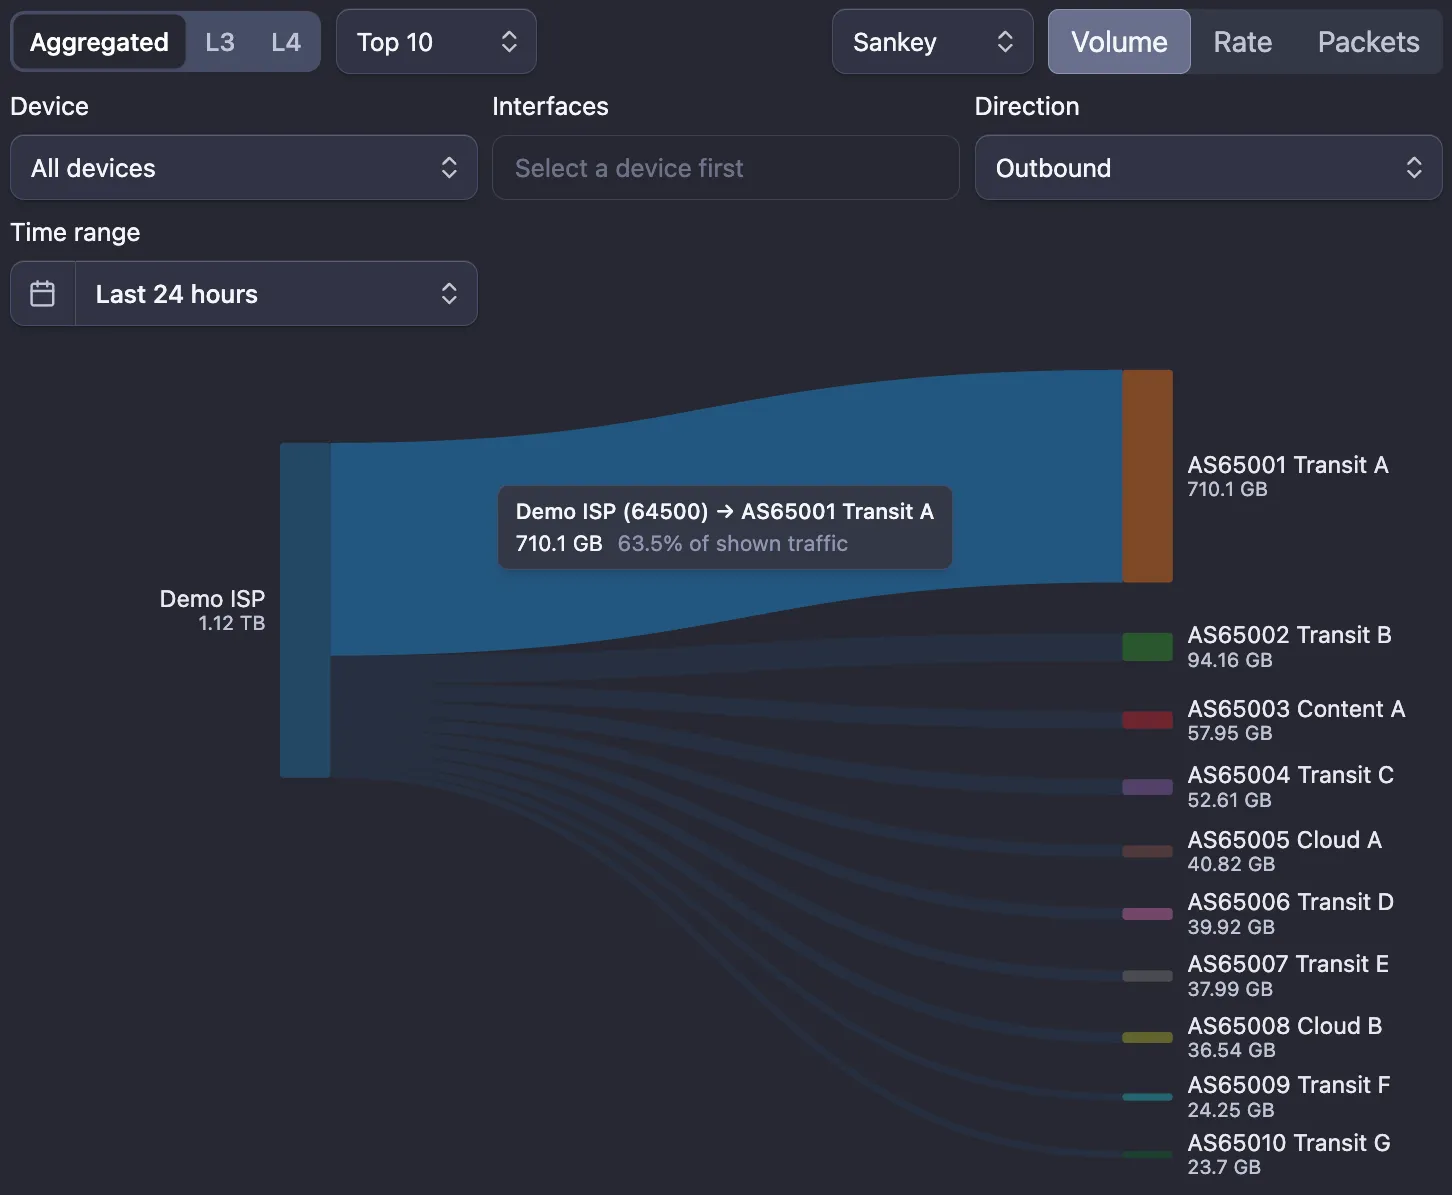
Open Flows in the sidebar. The filters along the top apply to every view:
- Device: all exporters, or one. See The device picker.
- Interfaces: one or more interfaces of the selected device that reported flows. Pick a device first.
- Direction: Any, Inbound or Outbound. Outbound leaves out traffic that stays inside your AS.
- Time range: Last 24 hours by default.
Choose the view in the selector in the top right, next to the Volume, Rate and Packets toggle (Endpoints and Ports offer Volume and Packets). Where a view ranks its rows, Top 10, Top 25 or Top 50 sets how many it shows.
| View | What it shows |
|---|---|
| Sankey | Traffic between autonomous systems. Aggregated shows plain AS-to-AS pairs. L3 splits them by IP version, with an IP ↔ IP or ASN ↔ ASN toggle. L4 splits them by protocol: TCP, UDP or other |
| Over time | Traffic grouped by the peer AS on the far side of yours. With Volume it is a pie chart with each peer’s share of the total; with Rate or Packets it is a stacked chart over time, with the peak and last value per peer in the legend |
| Endpoints | Destinations (destination, destination AS, protocol, port) or Conversations (source and destination with their AS), with packets and bytes |
| Ports | Protocol and destination port, with packets and bytes |
Over time needs Inbound or Outbound: with Any there is no far side to group by, and the page asks you to pick a direction. The AS views rely on routing data on the collector. If they stay empty while Endpoints or Ports show traffic, ask Extreme Labs to check it.
The device picker
The Device picker on both pages lists the exporters that sent flows in the selected time range, grouped by device type: BNGs, switches, OLTs and servers, in that order. Each one shows its hostname with the IP address and, where the device has them, its site, zone and region underneath.
NetSense matches an exporter to a BNG, switch, OLT or server in your inventory whose IP address is the one the flows come from. An exporter with no such device, or one of a type your role can’t view, is listed under Unknown by its IP address. If a router you know shows up there, check that it exports from the same IP address it has in your inventory.
Flow Logs
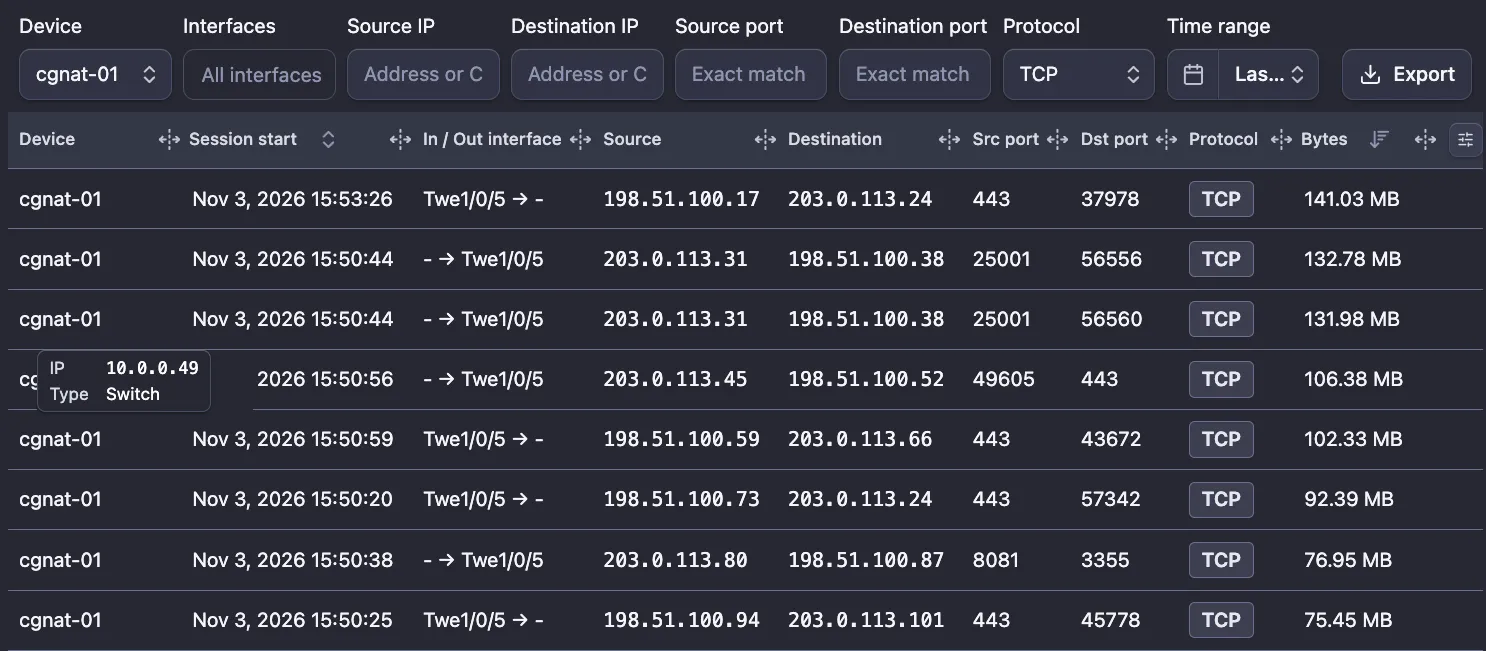
Open Flows → Flow Logs to search individual sessions. The filters:
- Device and Interfaces, as on Flows.
- Source IP and Destination IP: one address or a CIDR range, IPv4 or IPv6.
- Source port and Destination port: an exact port number.
- Protocol: Any, TCP or UDP. Sessions of other protocols (ESP, GRE, ICMP and so on) appear under Any only.
- Time range: Last 5 minutes by default.
The table lists the sessions 50 per page, largest Bytes first. Click Session start, Duration or Bytes to sort by another column. The other columns are Device, Session end, In / Out interface, Source, Destination, Src port, Dst port, Protocol, Packets, and the optional Device IP, Application, DSCP and Duration, which are hidden by default. Turn columns on and off from the table’s column settings; some only appear on a wide screen.
- Device shows the exporter’s hostname. Hover it for its IP address and type, plus its site, zone and region when the device has them. An exporter that isn’t in your inventory shows its IP address.
- Protocol shows the name; hover it for the IP protocol number.
- DSCP shows the raw TOS byte; hover it for the DSCP and ECN values.
The filters are kept in the page address, so a link to the page opens the same search.
Exporting flow logs
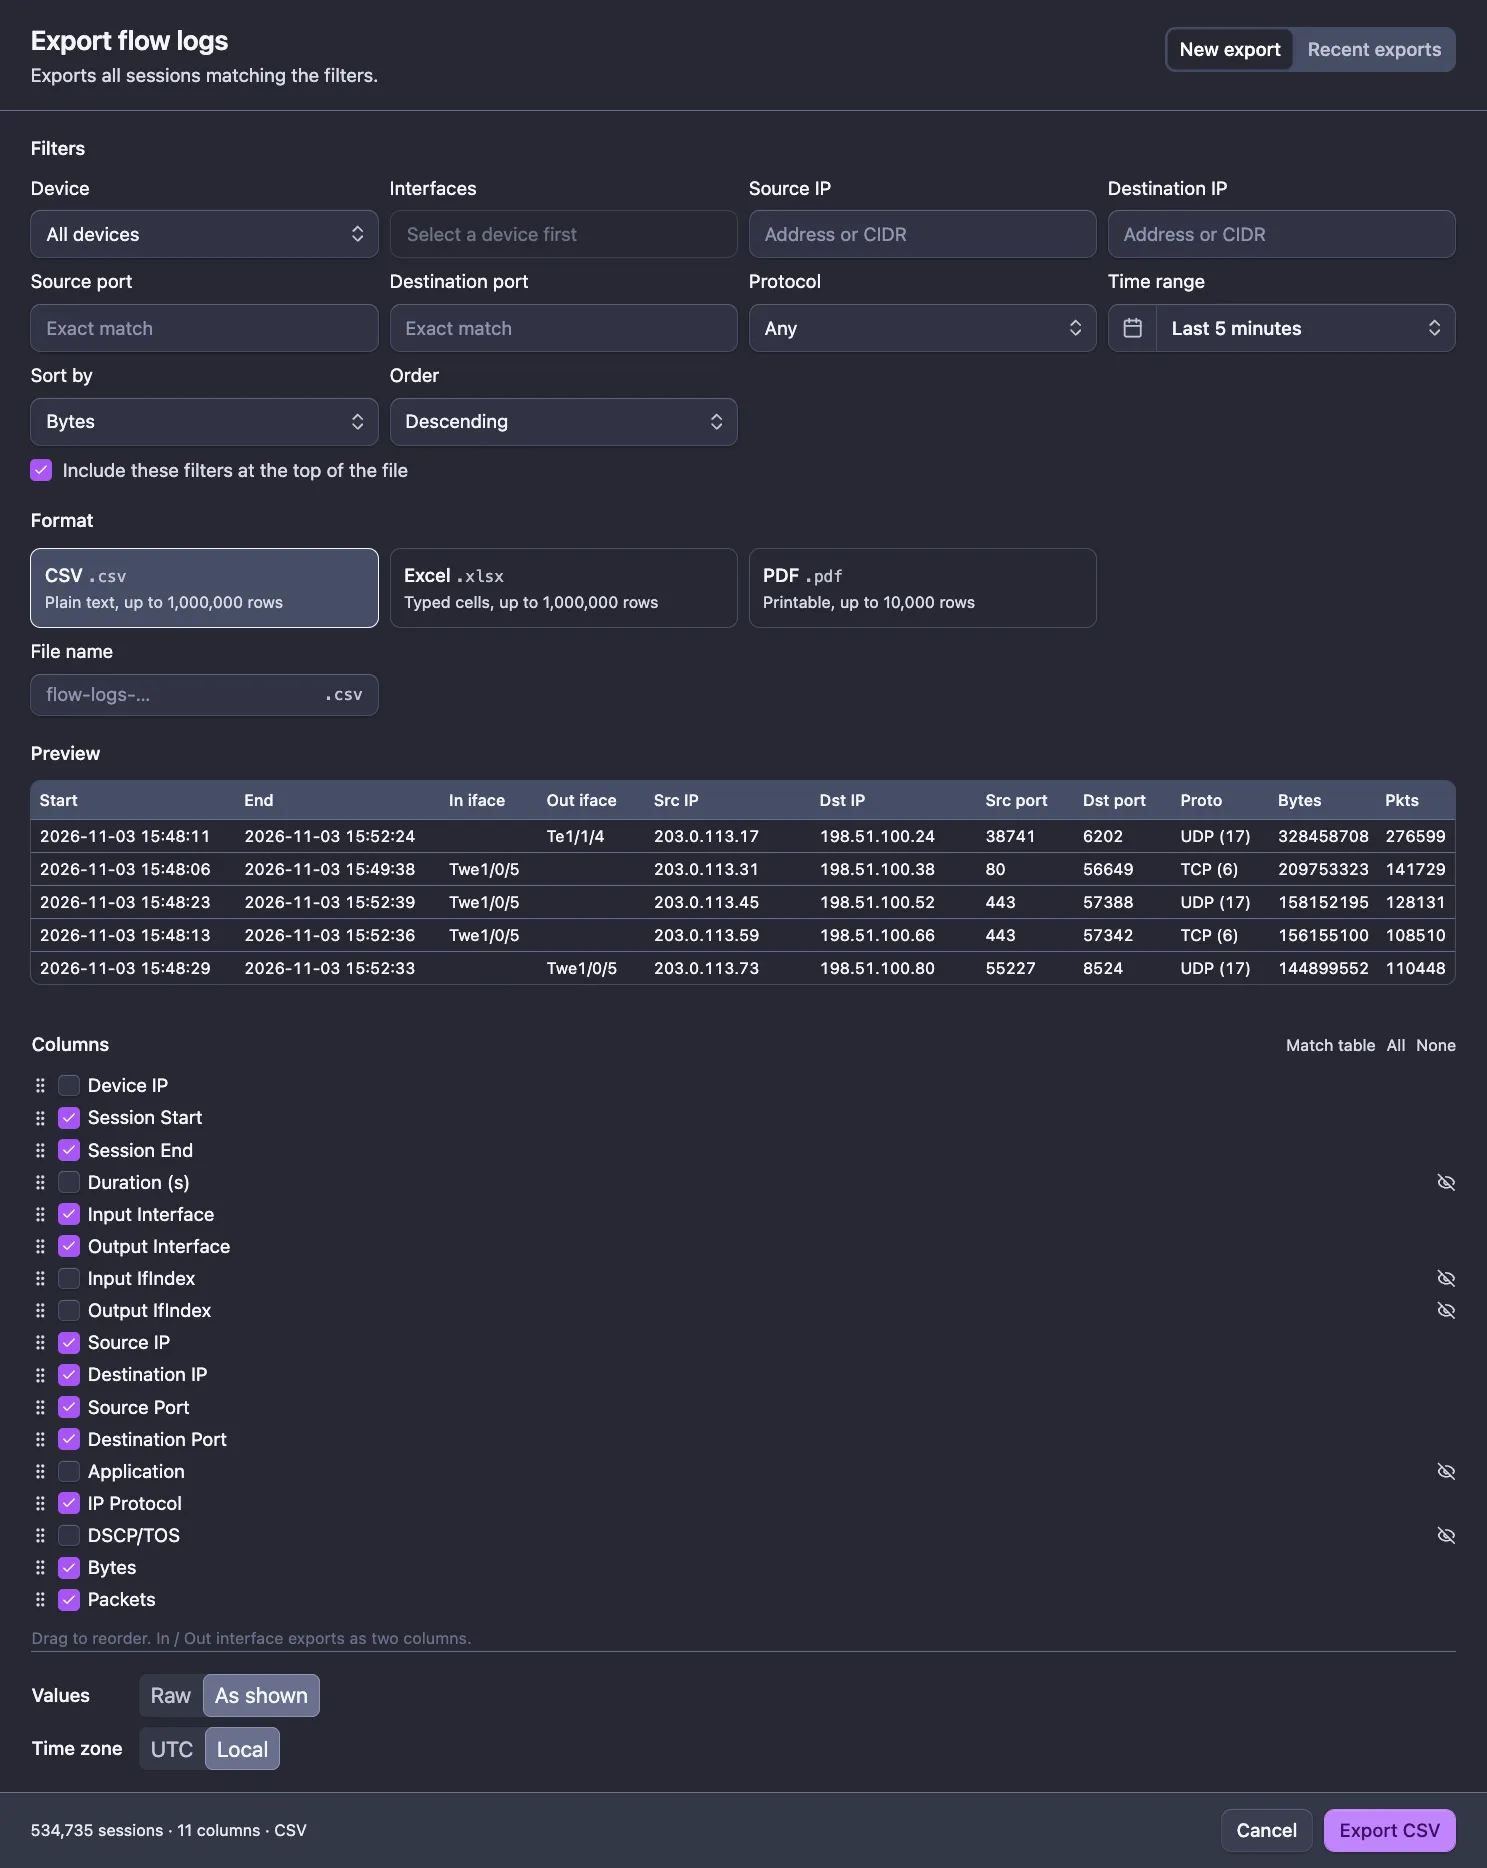
Click Export on Flow Logs. The export page opens with the same filters and sort, and exports every session that matches them, not just the page on screen.
- Filters: adjust the filters, Sort by (Session start, Bytes or Duration) and Order. Leave Include these filters at the top of the file on to start the file with a summary of the filters used. Protocols appear there as “TCP (6)”.
- Format: CSV (plain text), Excel (typed cells) or PDF (printable). Each option shows its row limit. Optionally give a File name; the extension is added for you.
- Columns (on the right, or below the form on a narrower window): tick the columns to include and drag them into the order you want. Match table picks the columns your Flow Logs table shows, All and None do what they say. An eye-slash icon marks columns hidden in your table and the interface index columns, which the table never shows. In / Out interface exports as two columns.
- Values: As shown (the default) writes dates as
2026-11-03 14:05:09and protocols asTCP (6). Raw writes Unix timestamps in seconds and bare protocol numbers. PDF always uses As shown. - Time zone: Local (the default, your browser’s time zone) or UTC. It applies to the timestamps.
- Check the Preview, which shows the first rows exactly as they will be written, and the footer, which counts the sessions and columns. Click Export CSV, Export XLSX or Export PDF.
Your format, columns, values and time zone choices are remembered in your browser for the next export.
Row limits
The export is refused, with a message in the footer, when more sessions match than the format allows. The defaults are:
| Format | Up to |
|---|---|
| CSV | 1,000,000 rows |
| Excel | 1,000,000 rows |
| 10,000 rows |
The limit that applies on your installation is printed under each format. To export more, narrow the time range or the filters and export in parts.
Recent exports
Exports run on the server, so you can leave the page while a large one is written. A notification follows its progress and offers Download when it is ready.
The Recent exports tab lists your own exports, newest first, with their Status (Queued, Running, Ready, Failed or Expired), row count, size, columns, values, time zone and Expires date. Filter by status in the top left.
- Cancel stops a queued or running export; no file is created.
- Download fetches a ready file.
- Delete removes a finished export and its file.
Files are kept until they expire, 30 days by default. Each person sees only the exports they started.