Every port NetSense polls appears in three places: a fleet-wide list per device type, the Ports tab of its device, and a detail page of its own. This guide explains what each column means, how LAG members and sub-interfaces are grouped, and how to correct a speed the device reports wrong.
Where ports live
- Fleet port lists. Every device type in the sidebar has a Ports child: OLTs → Ports, Switches → Ports, BNGs → Ports, Servers → Ports and Wireless → Ports. Each lists the ports of every device of that type, sorted by utilization, highest first. The search box at the top has a field selector: pick what to search by (for example Hostname) before you type.
- The device page. Switches, BNGs, servers and wireless devices have a Ports tab. OLTs split it into PON Ports and Uplink Ports. Switches, BNGs and OLTs also have a VLAN Interfaces tab when the device reports VLAN interfaces, and a switch with coherent modules has a Coherent Optics tab.
- The port detail page. Click a port name in any list to open its own page. The page title says what kind of port it is: PON Port, Ethernet Port (an OLT uplink), Switch Port, BNG Port, Server Port, Wireless Port, VLAN Interface or Coherent Module. The breadcrumb at the top leads back to the device and the tab you came from.
Seeing ports needs the port permission of that device type, for example
switch:port:view or olt:port:view.
Reading a port list
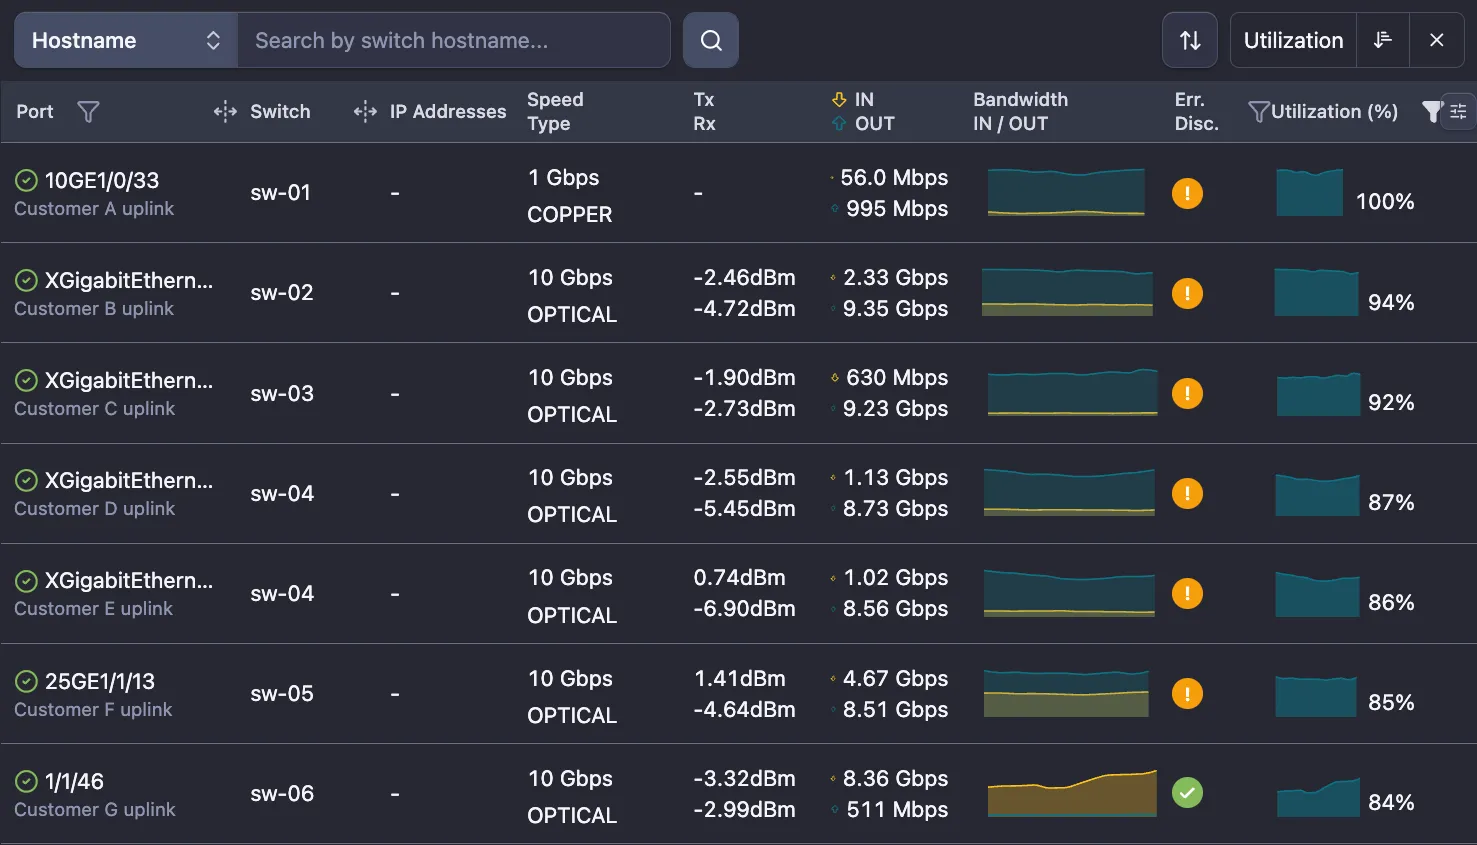
| Column | What it shows |
|---|---|
| Port | Status dot, port name and description. A description you edited in NetSense is shown in blue. |
| IP Addresses | The addresses the device binds to the interface (see IP addresses). |
| Speed / Type | Interface speed (or your custom speed) and the media type, such as copper or optical. |
| Tx / Rx | Optical transmit and receive power of the transceiver, in dBm. |
| Temp. | Transceiver temperature. |
| Bandwidth IN / OUT | Current traffic and a spark of the recent trend. |
| Err. / Disc. | One badge for errors and discards (below). |
| Utilization (%) | Current utilization against the port speed, with a spark. |
| Last State Change | When the port last went up or down. |
The Err./Disc. badge reads at a glance:
- a red ! means errors, an amber ! means discards, and a third color means both. Hover it to see the in and out rates per second.
- a green check means No errors or discards: every counter the port reports is zero.
- - means the port reports no error or discard counters at all.
Filter by errors. The Err./Disc. column header has a filter with With errors, Without errors, With discards and Without discards. It applies to the whole list, not only the page on screen. Errors and discards combine with AND, so With errors plus Without discards finds ports that only have errors. Picking both the “with” and the “without” option of the same kind cancels that kind out. The filter is on every fleet port list.
Sorting by a metric leaves out ports without a value. Sort by Rx power and a copper port, which has no Rx power, disappears from the list instead of sinking to the bottom. If a port seems to be missing, clear the sort first.
Choosing columns. The sliders icon at the right end of the header row opens the column list. Select all turns every column on, Reset to default goes back to the standard set. Some columns show by default only on wider screens, so a laptop starts with fewer. Your choice is remembered per table in your browser.
On the device Ports tab
The device tab has the same information in more detail: Errors, Discards and Utilization are split into IN and OUT, and the column list adds Voltage / Bias for optical ports and Unicast, Multicast and Broadcast packet rates (all hidden by default). On a switch, the toolbar filters by Port Status, Trunk, Port Name, Description and Utilization.
Two more ways to look at the ports:
- Expand a row for that port’s charts in place.
- Chart view (the chart icon next to the table icon, top right) draws one metric for every port of the device: bandwidth, utilization, errors, discards, Tx or Rx power, temperature, or a packet type. Show disabled adds administratively disabled ports.
Custom speed
Some interfaces report the wrong speed or none at all: a LAG or bond that reports one member’s speed, a virtual interface that reports 0, a 10G port that carries a 2 Gbps circuit. Utilization against the wrong speed is meaningless, so NetSense lets you set the real one.
To set it: hover the speed in the Speed column, click the pencil (Set custom speed), type the speed in Mbps as a whole number and confirm with the check button or Enter. Clear the field (or enter 0) and confirm to go back to the reported speed. Press Esc to cancel. The maximum is 10,000,000 Mbps.
You can do this on the device Ports tab, on the fleet port lists and on the VLAN
Interfaces tab of switches, BNGs and OLTs. It needs the port edit permission of that
device type: switch:port:edit, bng:port:edit, olt:port:edit, server:port:edit or
wireless:port:edit. VLAN interfaces on a switch use switch:port:edit.
A custom speed is shown in blue, and its tooltip gives the speed the device reports. From then on NetSense uses it everywhere the speed matters:
- the speed shown for the port, VLAN or interface
- port utilization, and the total utilization of the device, so one device can mix custom and reported speeds
- utilization threshold alarms
- the utilization color of the link on network maps
When to use it:
- LAGs and bonds whose reported speed is not the sum of their members, for example a MikroTik bond.
- Sub-rate circuits: a 10G port that carries a 2 Gbps transit contract, or a shaped customer port. Set the contracted rate and 80% utilization means 80% of what you pay for.
- Interfaces that report no speed, such as some VLAN interfaces and tunnels.
The custom speed belongs to that port. If a firmware or template change renames or renumbers the port, set it again on the new one.
LAGs and their members
On the Ports tab of a switch or BNG, LAG members are listed under their LAG (Eth-Trunk, Port-channel, ae, bond), so the LAG and its links read as one group. The Trunk filter shows one LAG with its members, or No Trunk for everything else.
The grouping is kept while you only filter by Trunk. As soon as you sort by a column or add another filter, the table switches to a flat list.
The port detail page of a member shows the LAG it belongs to in its information panel.
Sub-interfaces and VLAN interfaces
Routed traffic often lives on logical interfaces rather than on the physical port: dot1q
sub-interfaces (GE0/0/1.100, Eth-Trunk5.4051), Juniper units (xe-0/0/1.0,
ae0.100) and VLAN interfaces (Vlanif22). NetSense collects them with their status,
traffic and IP addresses on switches, routers and BNGs.
Sub-interfaces are nested under their parent port in the Ports tab, below the LAG member they ride on if the parent is a LAG. Each shows its status, IP address and traffic. They are not counted in the port totals or in the device traffic summary, so nothing is counted twice, and they do not count as licensed nodes.
Today this nesting covers:
- Juniper: units on physical ports and on ae LAGs.
- Huawei NetEngine routers: dot1q sub-interfaces on physical ports and on Eth-Trunks.
On other vendors (for example Cisco and Nokia), sub-interfaces are not nested. Where the device reports them as VLAN interfaces, they are listed in the VLAN Interfaces tab. Nokia SR OS BNGs expose no per-VLAN interface objects; for their subscribers per VLAN see BNG subscriber sessions.
The VLAN Interfaces tab lists the L3 VLAN interfaces (Vlanif, Vlan, VLAN2023)
with their IP addresses, speed (which you can override), traffic and packet rates. On a BNG,
sub-interfaces are kept even when they carry no address of their own, so the interfaces that
terminate subscriber traffic are always listed.
Alarms on sub-interfaces. Port alarm rules can target sub-interfaces with the port type
SubInterface. It also works the other way round: a rule with type == Ethernet leaves
sub-interfaces out. See Creating alarm definitions.
IP addresses
The IP Addresses column is on the port lists and the device Ports tabs. Addresses are collected on routed physical ports, bridge interfaces, LAGs, sub-interfaces and VLAN interfaces, so an L3 switch or router shows what is really configured on each interface. The BNG Ports tab and the BNGs → Ports list have the column too.
A port with no address shows nothing. That is normal for an L2 access or trunk port.
MikroTik
MikroTik devices show every interface type, not only Ethernet, VLAN, bridge and bond:
- PPP, VPN and wireless interfaces with their status, traffic, packet counters, errors and IP addresses, so an outage on a tunnel that carries a whole segment is visible
- EoIP tunnels
- Loopback interfaces on RouterOS 7
On a MikroTik added as a BNG, dynamic subscriber sessions stay in the Sessions tab and are not listed as ports.
Copper and optical ports are told apart reliably, including QSFP ports, SwOS devices and ports you renamed, which used to show an unknown media type. The media type is what the Type line under Speed shows, and it decides which ports get optical readings.
Optics on ports
Ports with a transceiver show their optical readings:
- Tx and Rx power in dBm, and the module Temp. in the port lists
- Voltage and Bias current on switch and BNG optical ports (columns hidden by default)
- the module’s own low and high thresholds for Tx and Rx power, where the module reports them
On a network map, the Rx Power and Tx Power toggles show the same readings at both ends of a fiber link. Rx is colored against these thresholds, and a reading at or below -40 dBm shows as “No light”.
To read the optics from the device right now instead of waiting for the next poll, open the port’s actions menu (the three dots) and choose Fetch Rx/Tx. It is offered on OLT, switch and BNG ports.
Coherent Optics. On switches with coherent modules (today the Edgecore 7716-24SC on OcNOS), the Coherent Optics tab lists each module with Laser Freq. (THz), Rx Power, Tx Power, Temp., OSNR (dB), Uncorrected FEC and Laser Age (%). Each module has its own detail page, and the same readings are available in alarm rules.
The port detail page
The page has a Traffic card with bandwidth, utilization, errors, discards and packet rates, each drawn for several time ranges side by side (1 hour up to 180 days; you choose which ranges are shown, and a normal-width window shows two at a time). Ports with a transceiver add a Sensors card with Tx power, Rx power and temperature. Packet charts are not available for OLT PON and uplink ports. The information panel on the right has the device, the port details (name, description, LAG, speed, media type) and port statistics.
Auto-refresh is off by default, so a page left open does not keep loading data. Use the refresh button to update now, or pick an interval from its menu: 1, 3, 5, 15 or 30 minutes.
From the actions menu you can also open Live Traffic, in place or in a new tab. How to read and zoom the charts is covered in Reading charts.
Related
- Alarm history of one port. On the device’s Alarms tab, filter by Entity and pick the port. With Show history on you get every down and up of that port over the date range, with the time each alarm opened and closed.
- Interfaces port alarms skip. On switches and BNGs some interfaces never raise port
alarms, for example a port whose description contains
testing. The list is in Creating alarm definitions. - Which ports count as nodes. LAGs, VLAN interfaces and sub-interfaces are not counted. See the FAQ.
- Links and maps are built on ports: see Building network maps.
Troubleshooting
A port or sub-interface shows zero traffic.
- Check the port status first. A port on a device that is down shows its last known values.
- On Huawei NetEngine routers, a sub-interface reads 0 until traffic statistics are enabled
on it on the router (
statistic enablein the sub-interface view). The physical port counts normally. - Some devices refresh their counters only every few minutes. Two polls with the same value are not a fault; look at a longer time range.
- If the port has traffic on the device and still reads 0 in NetSense after a few polls, contact Extreme Labs support with the device and port name.
The speed or utilization is wrong. The device reports the speed. If it reports one member’s speed on a LAG, 0 on a virtual interface, or the line rate of a sub-rate circuit, set a custom speed. Utilization, alarms and map colors follow it on the next poll.
Sub-interfaces are missing. Check which vendor the device is. Nesting in the Ports tab covers Juniper and Huawei NetEngine; on other vendors look in the VLAN Interfaces tab. If a Juniper or NetEngine device still lists none, make sure it is added with the correct manufacturer and model (see Adding devices), then contact Extreme Labs support. Supported models are listed in Supported vendors.
A port disappeared from the list. Clear the sort: sorting by a metric hides ports that have no value for it. Clear the Err./Disc. and status filters too.