Wireless radios are a device type of their own in NetSense. A radio added as a Wireless device gets its own section in the menu, a device page with signal quality per RF chain (SNR, RSSI, Tx power, noise floor and PHY rate), and its own alarm types, next to the traffic, ping and health data every device gets.
Coverage is narrow today and this page is explicit about it: only the models in the next section are polled.
Supported radios
| Manufacturer | Model | Notes |
|---|---|---|
| Mimosa | Any model | All Mimosa models use the C5x template |
| Airspan | C5x | The same hardware, reporting itself as Airspan |
| MikroTik | RB SXT G-5HPnD r2 | This exact model only |
The template is picked from the manufacturer and model names on the device, and for Wireless devices the match is strict: the spelling must be exactly as in the table (capitalization does not matter). Any other manufacturer or model, including other MikroTik boards and Ubiquiti or Cambium radios, is not polled at all. The device stays Unknown, with no uptime, firmware or radios, and nothing in the UI says why.
So if a new radio stays Unknown, check the manufacturer and model spelling against the table above and supported vendors first. For any other model, ask Extreme Labs: support for a new radio is added per model.
Adding a radio
Wireless devices are added by hand, one at a time:
- Go to Inventory → Devices → Create Device.
- Set Device Type to Wireless.
- Enter the Hostname, the management IP Address and the SNMP Community.
- Pick or type the Manufacturer and Model exactly as in the table above. For a Mimosa radio, use the manufacturer Mimosa and the model the radio reports, for example C5x.
- Save. The radio is polled by the agent like any other device, so its SNMP access list must allow the agent’s IP.
The rest of the form (zone, site, partner, SNMP settings) works as for any device. See
adding devices. Editing a Wireless device needs
wireless:edit, the same way switch:edit covers switches.
For a point-to-point link, add both ends: each radio is its own device.
The Wireless section
A Wireless entry appears in the sidebar as soon as the first wireless device exists in the tenant. It has two children:
- Ports: every port on every radio, with its device, bandwidth, utilization and last state change.
- Radio Links: the links NetSense has paired from both ends, with Point A Device and Point Z Device (each with its interface), the link Status (Connected, Disconnected or Unknown) and Last Observed. See Radio links for when this list fills.
The Dashboard also gets a Wireless Overview tab, and wireless radios count in the All Devices dashboard.
The Wireless list
The list shows one row per radio. The default columns are status, hostname, a ports summary, the number of Radios, Packet Loss (%) and RTT (avg ms) from the agent’s ping, temperature, CPU, RAM, bandwidth and the last update. CPU and RAM stay empty on radios that do not report them.
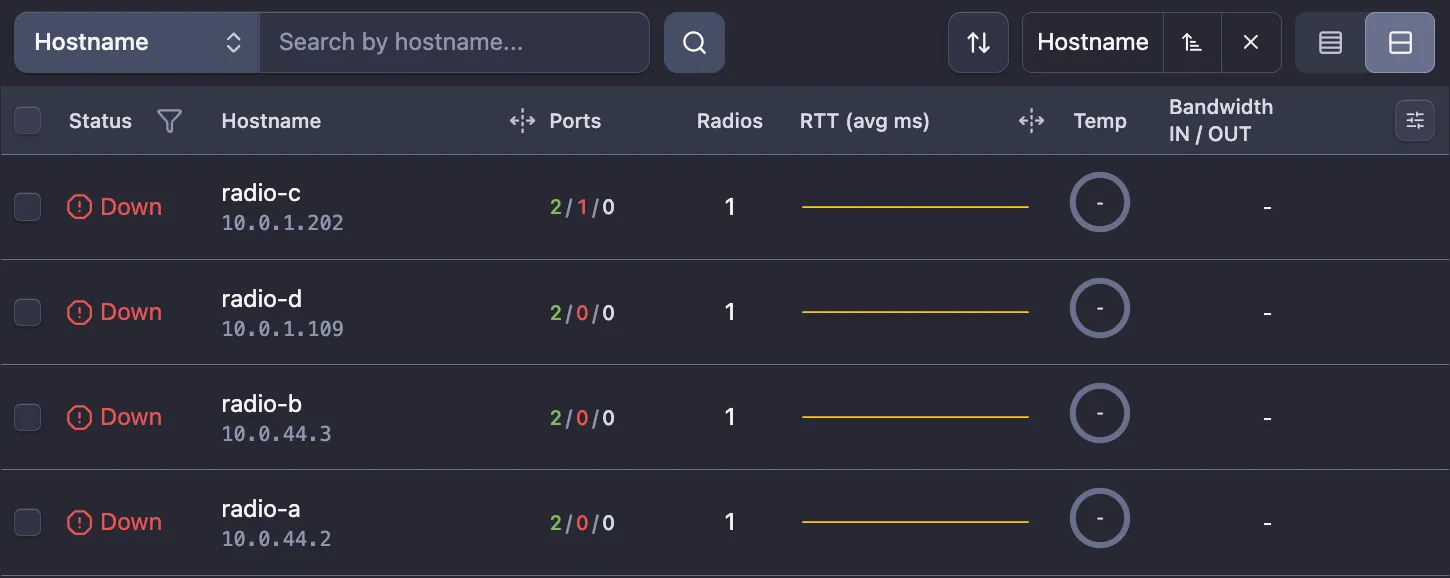
Select radios to export them as CSV, or to poll them now with Refresh Wireless (needs
wireless:report).
The device page
Overview
The Overview tab has the charts every device has (Wireless Performance with traffic, latency, loss and jitter, and Wireless Health with CPU, RAM and temperature), plus the Radio Performance chart:
| Tab | What it shows |
|---|---|
| PHY Rate | Tx and Rx PHY rate: the modulation rate the link is running at, not the traffic |
| SNR | Signal-to-noise ratio per chain, in dB |
| RSSI | Received signal strength per chain, in dBm |
| Tx Power | Transmit power per chain, in dBm |
| Noise Floor | Noise floor per chain, in dBm |
Every chart has one line per RF chain (Chain 1, Chain 2, …), so when one chain of a link degrades while the other holds, the two lines drift apart and it shows at a glance. On a device with more than one radio, a selector next to the title picks the radio.
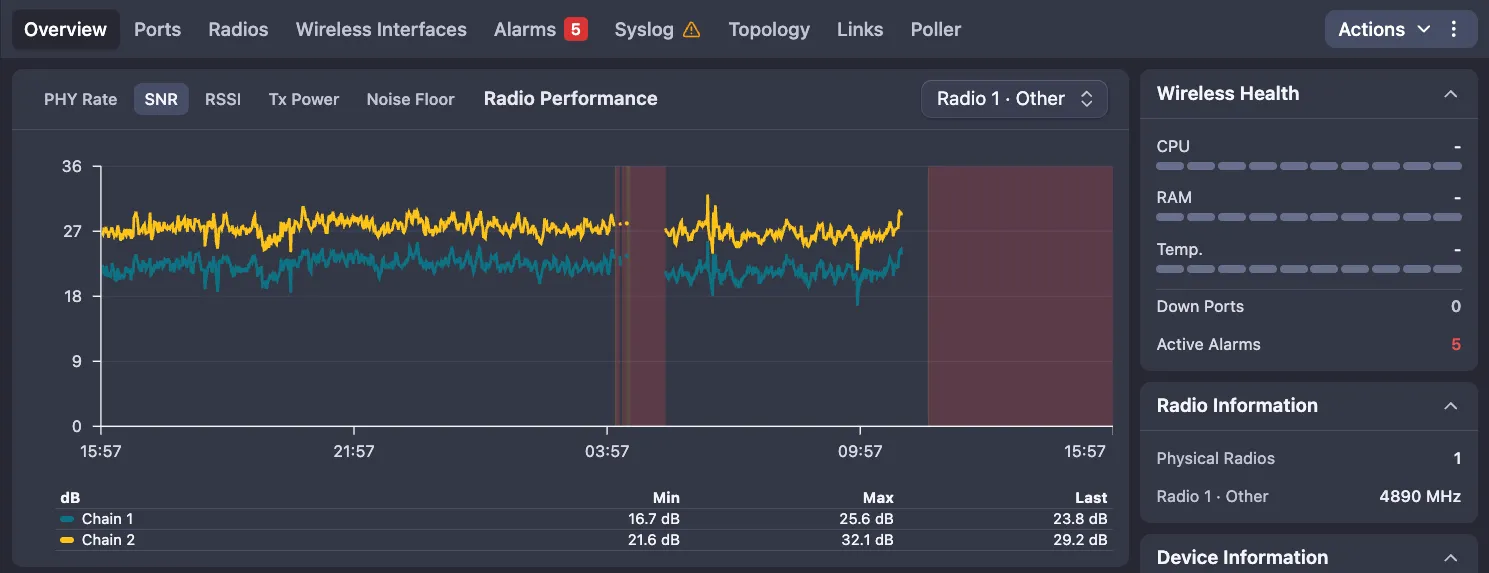
Radio Information in the right-hand panel lists the number of Physical Radios and, for each radio, its channel or center frequency.
Radios and Wireless Interfaces
- Radios lists each radio with its Band, Channel, Frequency and Width, PHY Rate (Tx / Rx), SNR / RSSI and Tx Power / Noise Floor (averaged over the chains), the number of wireless interfaces and Last Updated. Expand a radio for its history.
- Wireless Interfaces lists the radio interfaces with their Mode (AP or Station), MAC, SSID, BSSID, Security and Broadcast.
Both tabs need wireless:radio:view. Ports (with wireless:port:view), Alarms,
Syslog, Topology, Links and Poller work as on other device pages.
Radio links and connections
Two more tabs appear only when the radio reports the peers it is talking to:
- Connections: each peer seen on a local interface, with the remote interface, status, PHY rate, bandwidth, packets and Last Observed. Expand a row for its traffic.
- Radio Links: the link this radio is part of, paired with the device at the other end.
Not every radio reports its peers. Mimosa and Airspan C5x radios do not, so on a C5x the Connections and Radio Links tabs do not appear, and the Radio Links list in the sidebar stays empty even when both ends of the link are in NetSense. Their signal, PHY rate and traffic are still collected in full. The MikroTik RB SXT G-5HPnD r2 can report peers from its registration table, so the tabs appear on it once it has registered peers.
Alarms
Wireless devices have two alarm report types of their own in alarm definitions:
- Wireless: device-level values such as status, ping results, CPU load, memory load, temperature and uptime.
- Wireless Port: port status, traffic and utilization, errors, discards, packet rates and speed.
Radio values (SNR, RSSI, PHY rate, noise floor) are charted but are not alarm fields.
Permissions
| Key | What it allows |
|---|---|
wireless:view |
See the Wireless section, list and device pages |
wireless:edit |
Add and edit wireless devices |
wireless:report |
Refresh Wireless on selected radios |
wireless:port:view |
See wireless ports and the Ports list |
wireless:port:edit |
Edit port descriptions and settings |
wireless:port:delete |
Delete a port |
wireless:radio:view |
See the Radios, Wireless Interfaces and Radio Links views and the radio count |
The built-in roles have them already: viewer gets the three view permissions, admin and editor get all seven. Custom roles need them added by hand. See users, roles and partner access.
Node count
A wireless device counts as one node, plus one node for each of its ports and one for each radio. Tenant admins see the live count under Reports → Pricing. See how licensing counts nodes.
Limits
- Only the three manufacturer and model pairs above are polled. Everything else stays Unknown with no explanation in the UI.
- Radio links need the radio to report its peers. Mimosa and Airspan C5x do not.
- There are no alarms on radio values such as SNR or RSSI yet.