Dashboard is the first entry in the sidebar and the page NetSense opens when you sign in. Its first tab, All Devices, puts OLTs, switches, BNGs, servers, wireless radios and other devices on one screen: how much of the network is up, what needs attention right now, and where to click next. It is built for the first five minutes of a NOC shift.
The tabs on the Dashboard
The row of tabs at the top of the page (titled Network Live Dashboard) shows one tab per device type your tenant has, plus the dashboards your team built:
- All Devices: this page. It appears when the tenant has more than one device type.
- OLT Overview, Switch Overview, BNG Overview, Server Overview and Wireless Overview: one per device type in the tenant, each with status, temperature, CPU, port and alarm widgets and Top 10 lists (most open alarms, longest downtime) for that type alone. The OLT tab adds ONU status, Rx power and down reasons.
- More: your custom dashboards. The + in front of the tabs creates one.
NetSense remembers the last tab you opened in each tenant on this browser and opens that one
next time. The tab is also in the address (?tab=all), so a NOC wall screen can be
bookmarked straight to it.
The dashboard refreshes itself every minute. It pauses while the browser tab is in the background and catches up as soon as you return to it.
Network overview
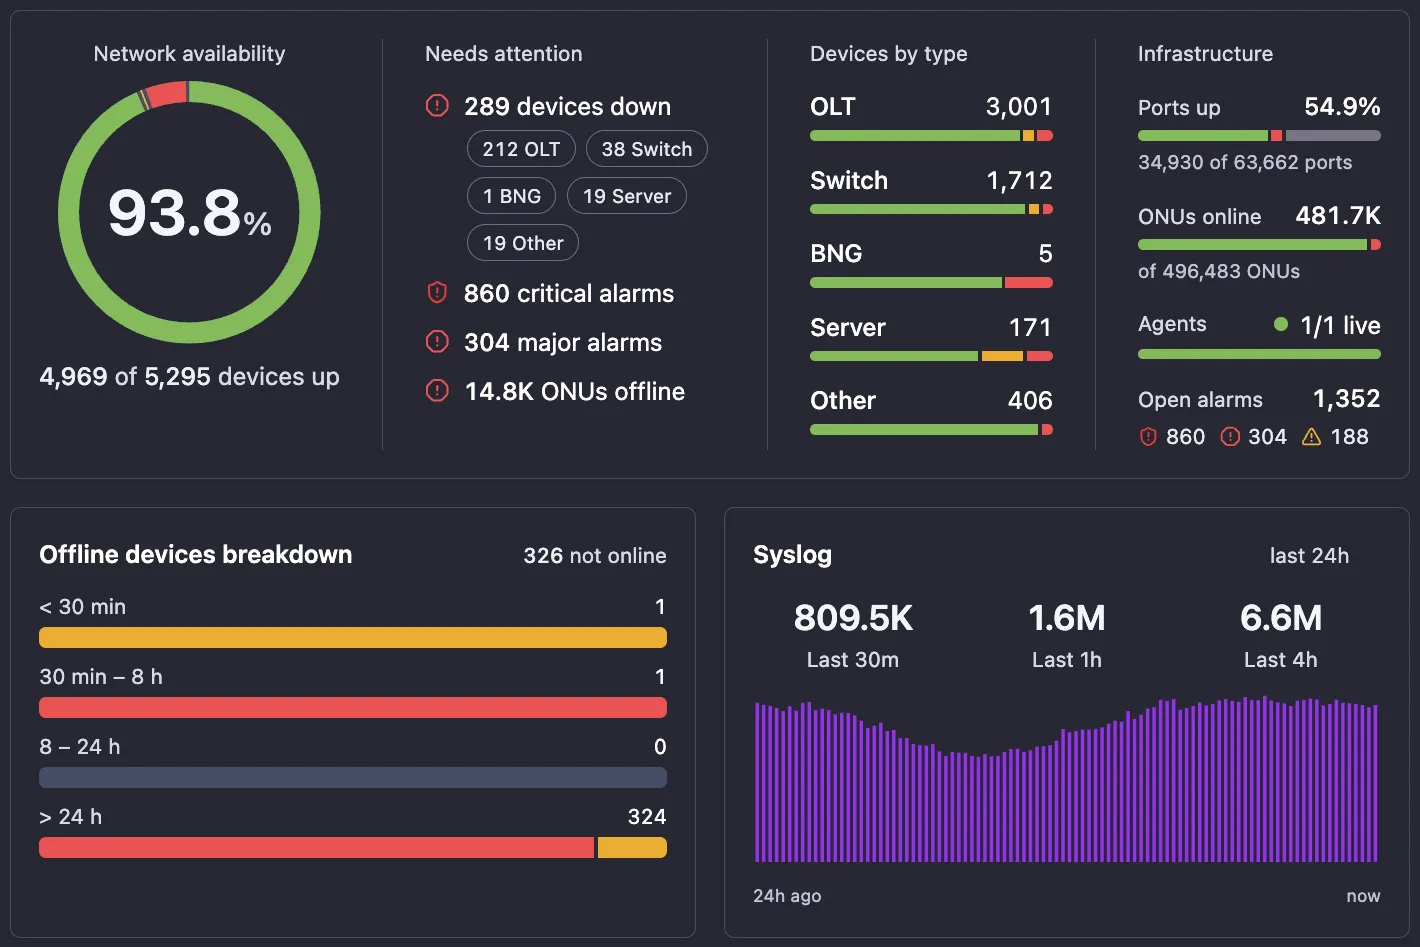
The top card answers “is the network OK?” in four parts.
Network availability is the share of all devices that are up, with the count underneath (“1,204 of 1,232 devices up”). The ring around it is split by device status.
Needs attention lists only what is wrong, worst first:
- devices down, with a chip per device type (“12 OLT”, “3 Switch”). Each chip opens that type’s device list filtered to Down devices.
- critical alarms and major alarms, each opening the Alarms page filtered to that severity.
- ONUs offline, opening the ONU list filtered to offline ONUs (tenants with OLTs only).
When nothing qualifies it reads All systems operational.
Devices by type has a row per device type with its device count and a status bar. Click a type to jump to its Overview tab (other devices open the Other device list).
Infrastructure sums up the rest:
- Ports up: the share of all ports that are up, with the count.
- ONUs online: how many ONUs are online out of the total.
- Agents: how many of your polling agents are live. An agent counts as live when it is active and has checked in within the last five minutes. The dot turns red when any agent is not live.
- Open alarms: the total, with a count per severity.
Offline devices breakdown
Every device that is not online (Down, Warning or Unknown), grouped by how long it has been in that state: under 30 minutes, 30 minutes to 8 hours, 8 to 24 hours, and over 24 hours. Each bar is split by status; hover it for a table by device type.
This is the card that separates the fresh outage from the long-standing one. A jump in the first bucket is something happening now. The over-24-hours bucket is the list of devices to fix or remove from inventory, since every one of them pulls the availability figure down. Devices with no status timestamp are counted separately under the bars.
Syslog
Syslog message counts for the last 30 minutes, the last hour and the last 4 hours, with a 24-hour bar chart underneath. Click the card title to open the Syslog page for the last 24 hours. Very large counts are shown with a +.
A sudden wall of syslog often comes before the alarms do: a flapping uplink or a looping port fills the log first. The card is shown to users who can read syslog. See device syslog.
Ports and health by type
One row per device type, side by side:
| Column | What it shows |
|---|---|
| Ports | How many ports NetSense polls on that type |
| Port status | Up, down and other ports as a bar; hover for counts and percentages |
| Temp | Device temperature: ok, or how many devices are in the warning (warn) or critical (crit) range |
| CPU | Device CPU load, read the same way |
| Port util | Port utilization in bands; hover for the breakdown |
Click a type to open its Overview tab. Temperature, CPU and utilization only appear for types whose devices report them. See device health.
Open alarms
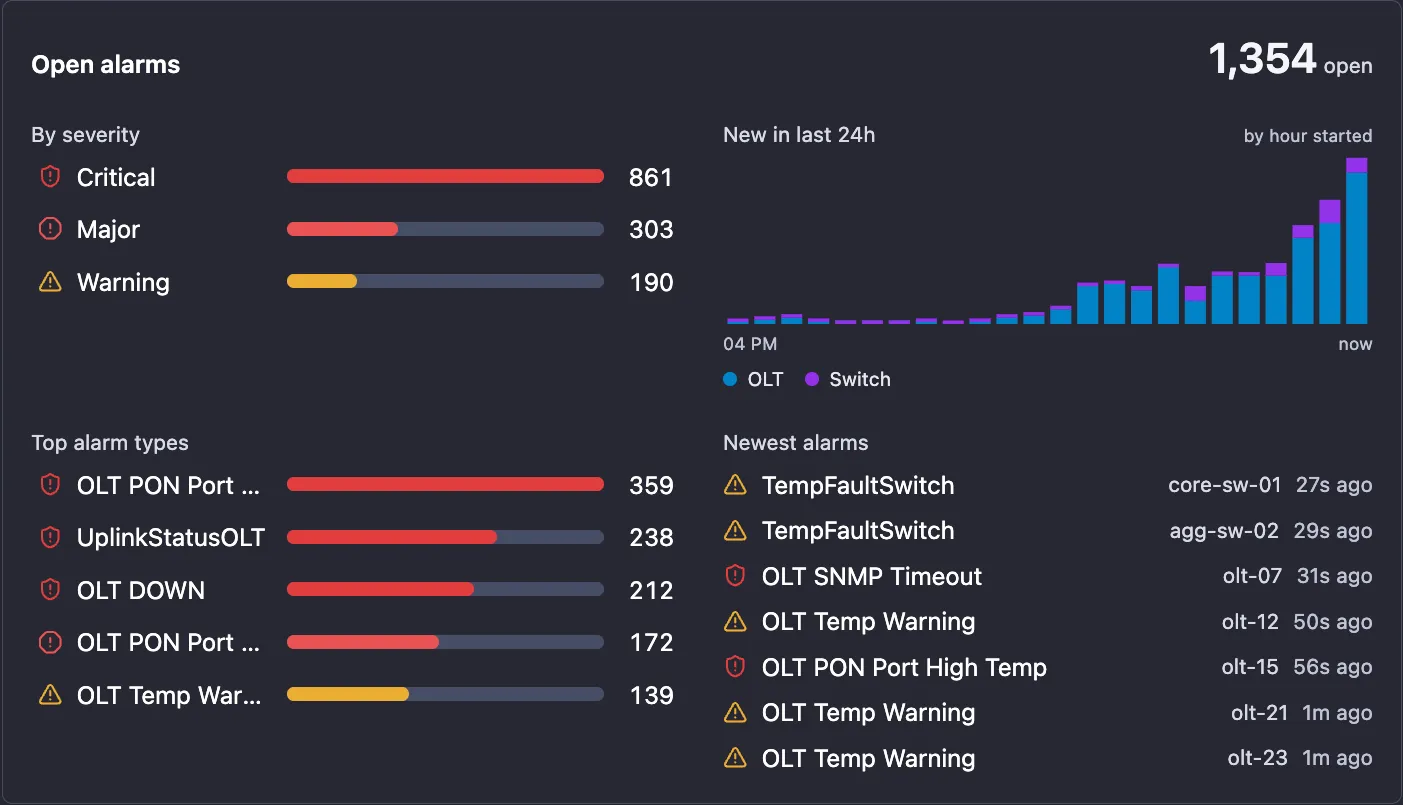
The total number of open alarms, split four ways:
- By severity: a bar per severity. Click one to open the Alarms page filtered to it.
- New in last 24h: one bar per hour, by the hour the alarm started, stacked by device type. It shows when the trouble started and where.
- Top alarm types: the five alarm definitions with the most open alarms. Click one to open the Alarms page filtered to that definition.
- Newest alarms: the seven most recent open alarms, each with its device. Click the hostname to open the device.
You need permission to view alarms to see this card. See handling alarms.
Metrics overview and ONUs
Metrics overview shows the whole fleet’s Device temperature, Device CPU, Port temperature and Port utilization as status bars, with the same ok / warn / crit chip.
ONUs (tenants with OLTs) shows how many ONUs are online, and bars for Status, RX power, Down events and Temperature. A growing share of ONUs outside the good Rx band across the fleet is a fiber plant trend worth catching early. See monitoring ONUs.
Inventory
The device count, manufacturer count and model count, with a bar per manufacturer (the top eight, the rest grouped as Other), each bar stacked by model. Hover a bar for its models (for Other, the manufacturers it groups). Click the card title to open Inventory → Devices.
Using it at shift start
- Check Needs attention. Anything listed there is the first job. Open the down devices per type and the critical alarms from their chips.
- Read the offline breakdown. Anything in the under-30-minutes bucket is new since the last shift. Compare the over-24-hours bucket with the handover notes.
- Look at the alarm timeline. A spike in one hour on one device type usually means one event behind many alarms. Start from Newest alarms or Top alarm types.
- Glance at Agents. A polling agent that is not live means a whole group of devices is not being polled, and their status is stale. See device states.
- Check syslog volume. A count well above the usual for the time of day is worth a look before it turns into alarms.
- Then go by type. Open the OLT, Switch or BNG Overview tab for the type that showed trouble, or the custom dashboard of the site in question.
Permissions
Every widget shows only what your role can see. Without permission to view any device type the device widgets read Access Denied; the alarm card needs permission to view alarms, and the syslog card is shown only to users who can read syslog. See users, roles and partner access.